A thread executes on a CPU; the data it accesses occupies physical memory. On a NUMA machine, reaching that memory can cost more depending on where the CPU and memory are located. Where work runs and where its data lives are separate placement decisions. Keeping them close can help, but keeping workers busy matters too: nearby data is little comfort when work is stuck behind a busy worker while another sits idle.
Reading guide: Sections 1-5 build the fundamentals around a checkout-log example. Sections 6-7 examine a Rust telemetry engine. Sections 8-9 cover trade-offs and measurement; implementation details are in optional notes.
1. Start with a simple machine
A CPU executes instructions: arithmetic, comparisons, branches, loads, and stores. A modern processor package usually contains several cores, each capable of executing an instruction stream.
Some cores support simultaneous multithreading, or SMT. They expose multiple hardware execution contexts, called hardware threads or logical CPUs. These share the core's execution resources. Two logical CPUs are not two independent physical cores, and they do not promise twice the throughput. Intel's introductory explanation makes this distinction explicit.
An application thread is different: it is a software execution stream managed by the operating system. Linux schedules runnable application threads onto logical CPUs. A thread can run, wait for I/O, resume, and later run on another eligible CPU. Many software threads can take turns using the same hardware.
RAM, or main memory, holds the program's data and instructions. It is usually dynamic RAM, or DRAM. Reaching it takes time: a request must travel through hardware, reach a memory controller, and be serviced by the memory chips. Requests can also queue behind other work.
Caches keep recently used data nearer the cores. They generally operate on fixed-size chunks called cache lines, not individual application objects. Small nearby caches are commonly called L1 and L2; a larger last-level cache may be shared. Hardware coordinates cached copies and writes through cache coherence. A read can be served by a cache, including another core's cache, without reaching RAM.
How do threads reach their data? In Figure 1, the OS schedules application threads onto the hardware threads inside each core. The caches sit between those execution resources and main memory.
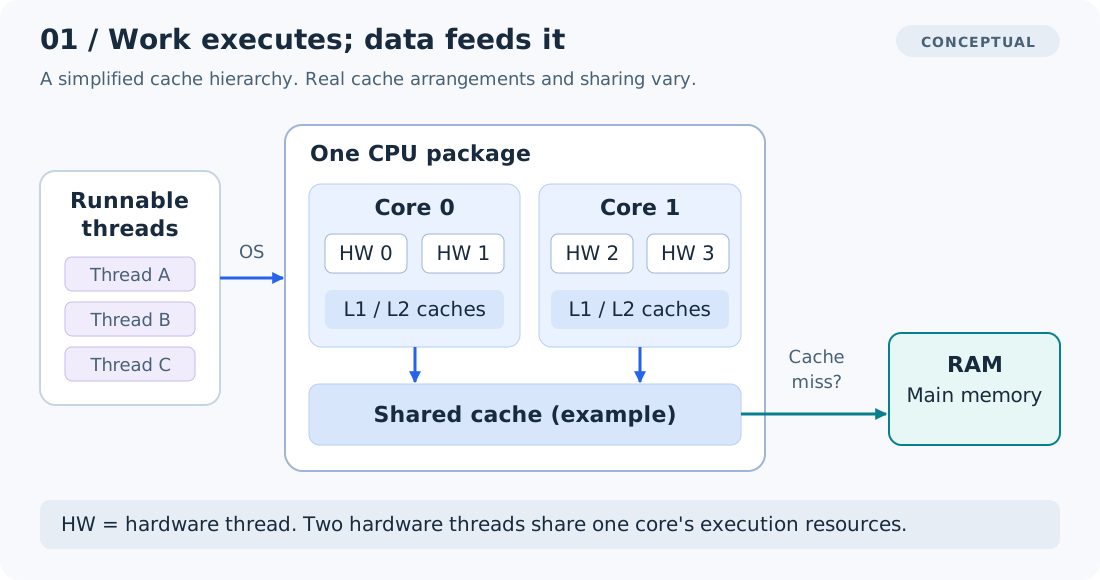
The path to RAM is needed only when caches cannot supply the data. More cores therefore do not solve every bottleneck: threads can wait on a lock, contend over cache lines, exhaust memory bandwidth (the rate of data transfer), or wait for a network destination. Larger machines also need ways to serve more memory traffic.
2. Why NUMA exists
Now make the machine larger. A socket is the physical connection for a processor package. Servers can have multiple sockets, and packages can contain multiple internal compute and memory regions.
A memory controller manages access to memory channels, the links to memory modules. Instead of forcing every core through one uniform memory-access domain, a larger system can distribute controllers and RAM. Hardware interconnects link those regions so processors can still access the whole shared memory space.
In a UMA model, uniform memory access, main-memory access costs are broadly uniform with respect to the requesting processor's location. This does not mean every individual load takes the same time: caches and contention still matter.
In NUMA, non-uniform memory access, the route to memory depends on where the requesting CPU and the memory are located. Think of a NUMA node as a hardware neighborhood, usually containing CPUs and nearby memory. The operating system exposes it as a locality domain.
Compare the two arrangements in Figure 2. The depicted UMA system sends both groups of cores through one memory controller. The NUMA system gives each node its own controller and RAM, with an interconnect between them.
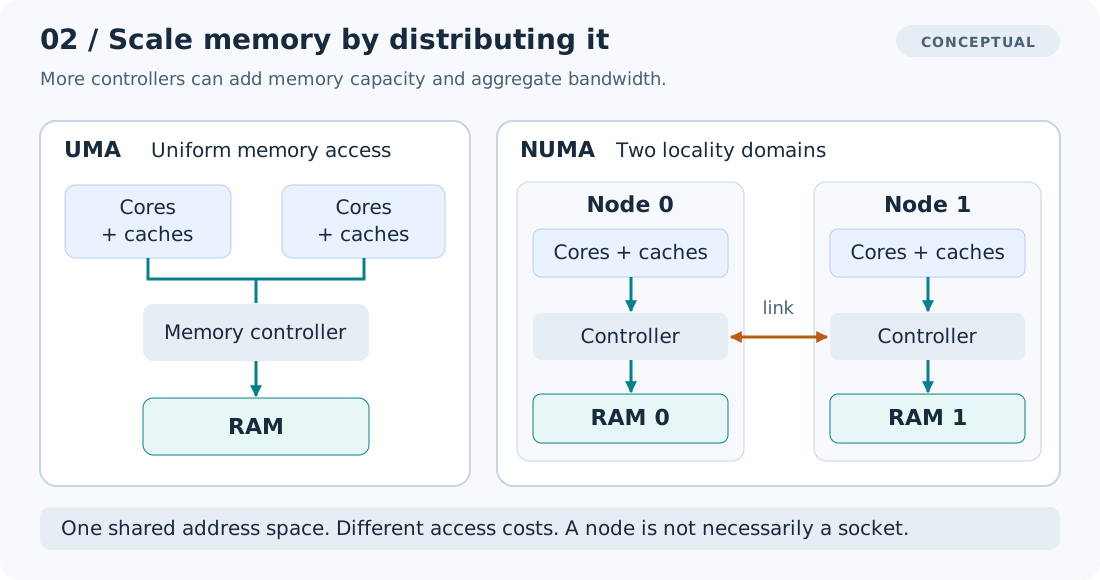
Both arrangements provide shared memory. For a CPU on node 0, RAM 0 is local and RAM 1 is remote. Hardware routes requests automatically; a remote address remains usable, and accessing it does not move the entire object closer.
The extra controller is useful for more than capacity. Multiple controllers can provide greater aggregate memory bandwidth, provided work actually uses them. The software cost is that one legal pointer can be cheap for one worker and expensive for another. Address-space sharing does not erase physical distance.
A socket is not necessarily a NUMA node. AMD's NPS settings and Intel's Sub-NUMA Clustering can expose multiple domains within one socket. Linux also supports memory-only nodes; some CPU-bearing nodes have no local memory. Node, socket, core, and cache-sharing group are different concepts. AMD architecture overview; Intel SNC documentation; Linux node model.
Most conventional NUMA servers provide cache-coherent shared memory. That does not make all accesses equally fast or replace the locks and atomics a program needs. Coordinating cache ownership itself consumes time and bandwidth.
3. One batch of logs, five placement scenarios
An online store's checkout service logs each completed request, including its
duration and an outcome of success or failure. These logs are telemetry:
operational data that helps developers understand application behavior.
A separate program receives the logs, keeps the failed-request records, and forwards them for storage or analysis. This is a telemetry pipeline. It processes batches, groups of records handled together. In our example, a worker is a thread doing that processing.
The worker executes on a CPU, but checking each record requires reading memory. Consider five alternative placement and sharing scenarios, not five successive pipeline stages. Some effects can coexist.
The worker and its data are local. Frequently reused state may stay in cache. When the worker needs data from DRAM, it uses its local memory domain. This is a good starting point, not a guarantee that the pipeline is fast.
The worker repeatedly scans remote memory. A large batch that does not stay cached can generate traffic across an interconnect to another memory controller. Figure 3 holds the worker on node 0: what changes when the records it reads are in node 1's RAM instead?
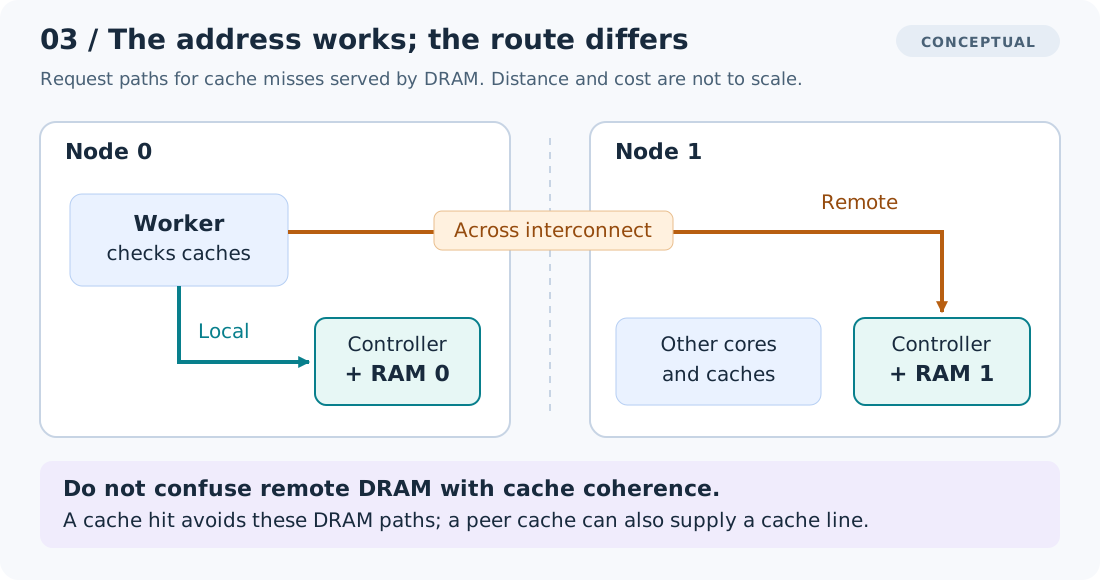
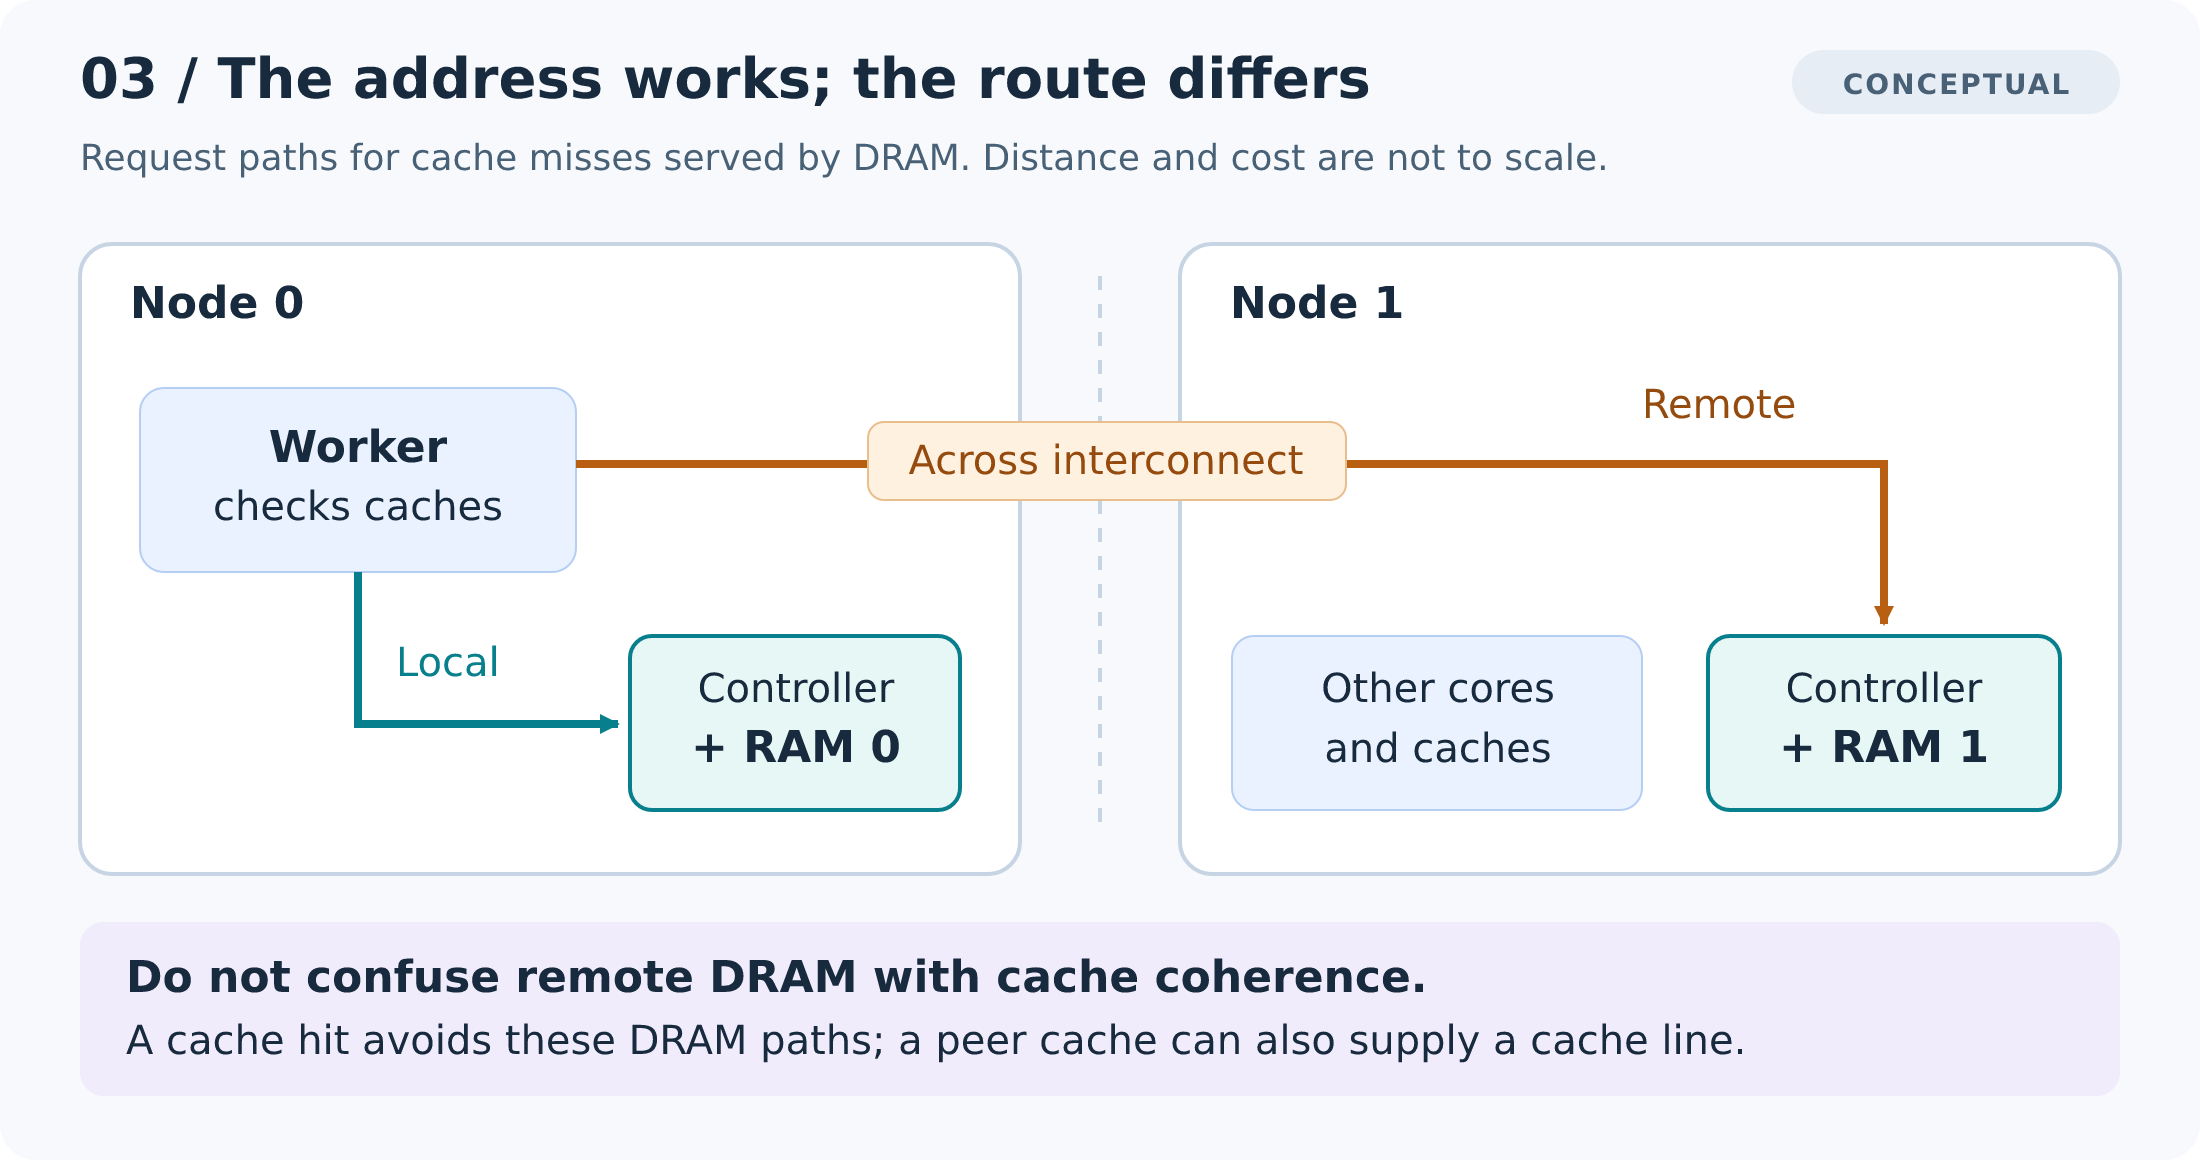
A request served by local RAM stays within node 0. Reaching node 1's RAM requires crossing the interconnect, adding a path that can take more time and consume link bandwidth. Cache hits avoid these DRAM paths; a peer cache can also supply data. Moving the worker can change which route is local.
The worker migrates. Its destination core may lack its working set, the data actively accessed during that period, in nearby caches. A move to another NUMA node can make existing data remote without moving the data itself. It does not automatically flush every cache or relocate the memory accessed.
Workers update separate counters on one cache line. Worker A increments its processed-record counter on one core; worker B increments another on a different core. If both counters occupy the same cache line, each core needs write ownership of that line, even though the variables are independent. Repeated updates can make ownership bounce between cores: false sharing. This is cache-coherence traffic, not the remote DRAM reads of a large batch, and it can occur within one socket. Separating hot counters may help, but extra padding costs memory and is not an automatic speedup. Intel's example; Kernel explanation.
The pipeline hands a batch to another node. Transferring its pointer changes who uses it, not where the records are stored. The consumer might read remote input while allocating new output locally. Queue metadata and reference counts can add coherence traffic independently of the payload's DRAM traffic.
Finally, distinguish latency, the time an operation takes, from bandwidth. Following a chain of pointers can expose latency because each read must wait for the previous one to supply an address. Parallel batch scans can instead saturate controllers or links. There is no universal "remote memory is twice as slow" rule; hardware, access pattern, caching, and load all change the result.
4. Linux makes three different placement decisions
Our checkout-log worker runs on a CPU while its batch occupies space in RAM. Those locations can belong to different NUMA nodes.
Linux manages physical memory in pages. Program pointers use virtual addresses, mapped to the pages that store the data: its physical backing. The pages holding the worker's data can also be accessed by other threads in the same process. A single buffer can span pages on several nodes.
To understand placement, ask three questions:
- Which CPUs may run the worker? CPU affinity constrains that choice; the scheduler chooses among the allowed CPUs.
- Which NUMA nodes supply the pages holding the data it accesses? Allocation policy, available memory, and when the pages are first populated influence placement.
- Can their physical location change afterward? Linux can migrate eligible pages between nodes. This is separate from moving the worker between CPUs.
Suppose this batch's pages were allocated on node 0 during initialization, then used by a worker pinned to a CPU on node 1. Figure 4 shows this particular placement; it is not a rule that every buffer lives on just one node.
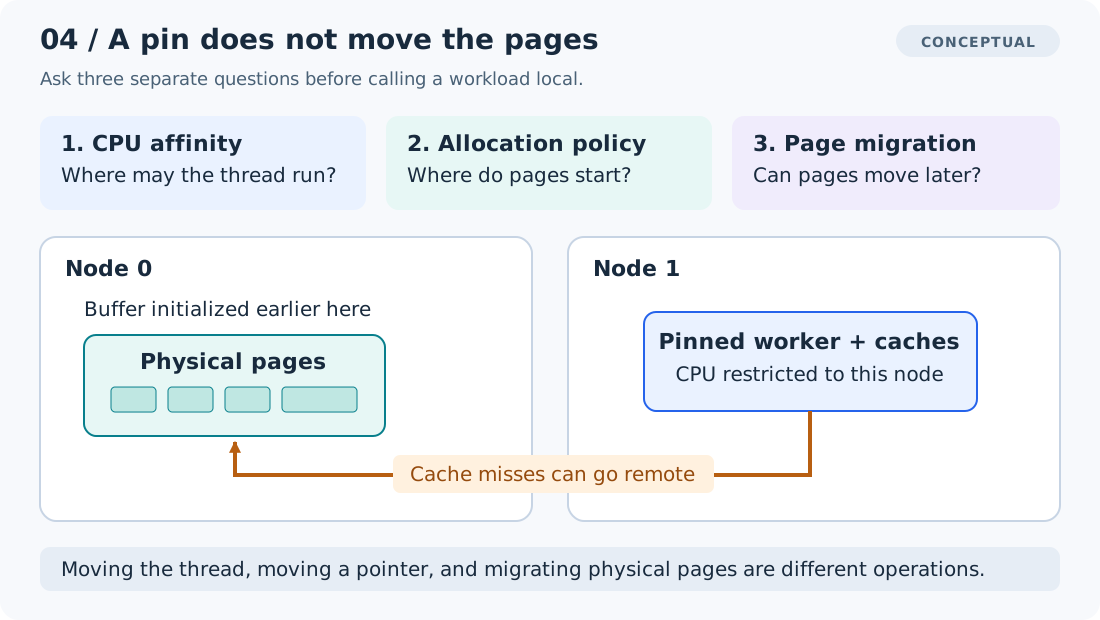
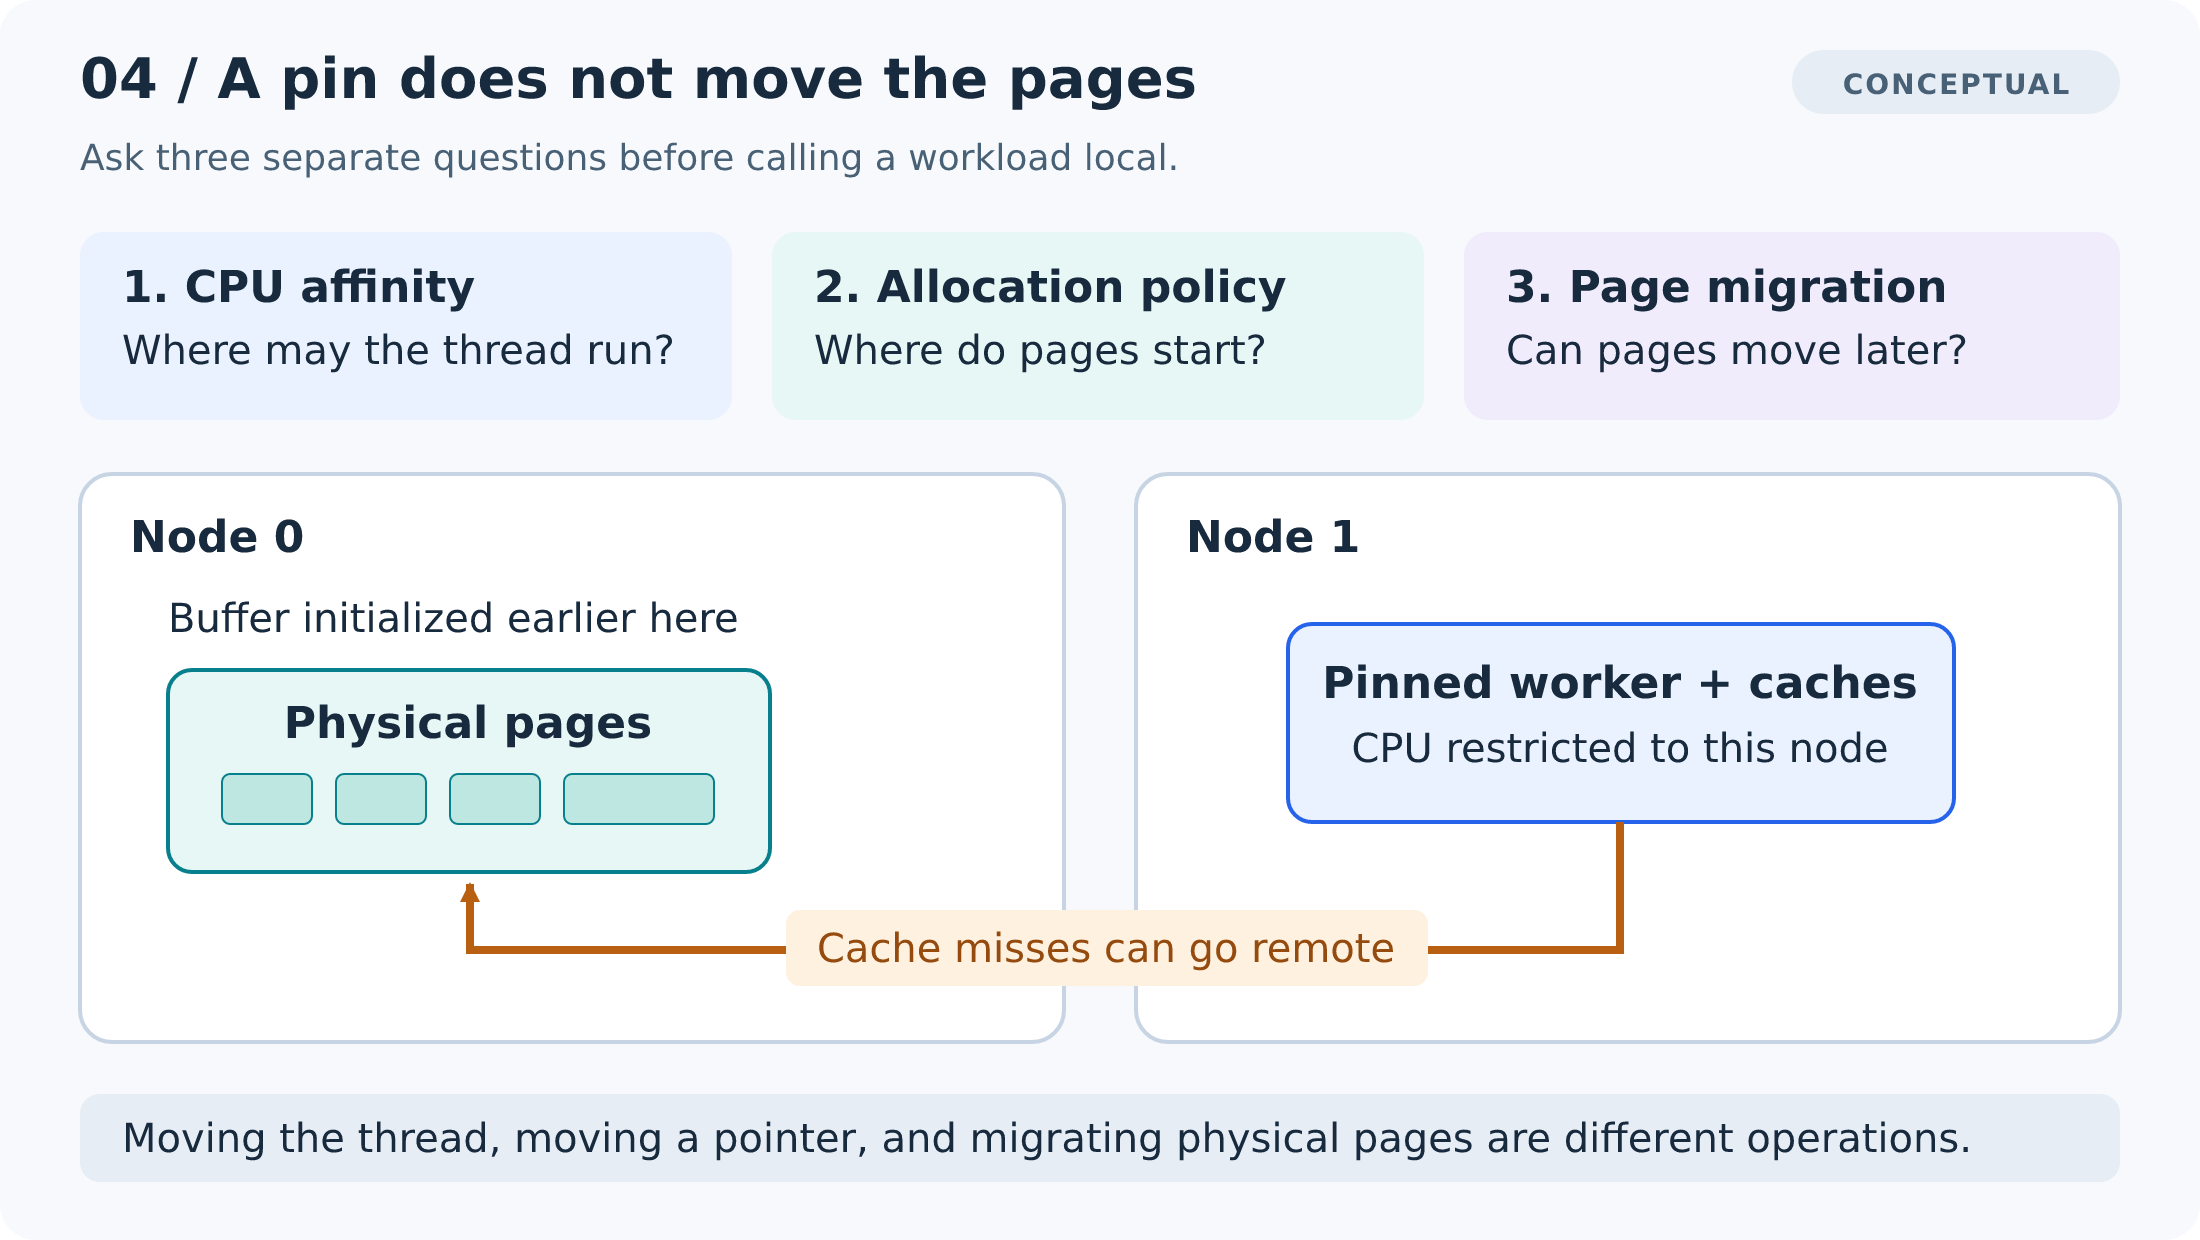
The worker's remote-access path leads back to the existing pages on node 0. Pinning alone does not relocate that buffer. The three controls at the top concern execution, allocation, and later migration; each answers a different question.
Scheduling is not memory allocation
Linux balances runnable work across eligible CPUs and can migrate threads. CPU affinity narrows a thread's eligible CPU set. Pinning commonly means restricting that set to one logical CPU. It is not exclusive ownership: other threads can still run there.
CPU sets, usually managed through control groups (cgroups), constrain a collection of tasks. Linux intersects affinity with applicable cpuset restrictions. Cgroups can also restrict eligible memory nodes. Separately, a CPU-time quota limits runtime over an interval; "two CPUs' worth of time" need not mean two particular CPUs. Affinity API; cgroup cpusets.
First-touch is a useful approximation, not a malloc contract
Compare two ways of initializing the same checkout batch buffers. Assume they need fresh physical backing, enough eligible local memory is available, and no policy overrides ordinary local allocation.
- The main thread initializes everything on node 0. Its writes generally allocate the pages there. When it hands some buffers to a worker on node 1, that worker starts with remote input.
- Each worker initializes its own buffers on its intended node. The worker on node 1 generally gets nearby pages for its writes; the worker on node 0 gets nearby pages for its own. The work is unchanged, but the initial memory placement differs.
Why do the writes matter? Requesting virtual address space need not immediately supply physical backing. A first write to lazily backed private memory can trigger a page fault that supplies it. Here the fault is a normal part of memory setup, not an application error. Choosing memory near the CPU doing that work is the basis of first-touch placement, not a promise about the allocator call itself. Linux allocation path; memory policy.
A newly returned buffer may instead reuse already-backed allocator memory. Writing it does not automatically move its pages. Initialization or allocator bookkeeping may also have touched the memory before the intended worker. Allocator reuse.
Read faults, shared mappings, and huge pages
The simple comparison concerns private memory not associated with a file (anonymous memory). Reading untouched anonymous memory can use a shared zero page; writing often requires private backing. Shared or file-backed mappings may already have backing populated by another thread or process, and policy can belong to a mapping or supported shared-memory object. Huge pages change placement granularity. Policies, cpuset restrictions, and memory pressure can change the target or cause allocation failure. Memory-policy documentation.
Allocation policies express different intentions
Linux supports per-thread default policies and policies for address ranges.
For example, set_mempolicy changes a calling thread's default; mbind targets
a range. In ordinary use, these govern future backing allocations, not an
automatic relocation of existing pages.
| Policy | Intended behavior | Important limitation |
|---|---|---|
| Normal local allocation | Prefer memory near the allocating CPU. | Other allowed nodes may supply memory when necessary. |
| Bind | Restrict allocations to specified eligible nodes. | Memory pressure can cause failure rather than ordinary fallback outside the set. |
| Preferred | Try a preferred node first. | Fallback is allowed. |
| Interleave | Distribute allocation targets across nodes. | Page-level distribution is not cache-line striping or guaranteed equal traffic. |
These policies remain subject to cpuset restrictions and mapping-specific
rules. numactl exposes many of them: --cpunodebind selects execution
CPUs by node, while --membind selects memory placement. They are not synonyms.
Placement can change after allocation
Start with a worker and its checkout buffer on node 0:
- Move the worker to a CPU on node 1. Execution moves; the buffer's pages can stay on node 0. Reads that once reached local RAM now cross nodes, as in Figure 4. This is CPU migration.
- Separately, move eligible buffer pages to node 1. Linux changes their physical location while the program continues using the same virtual addresses. This is page migration.
Neither movement automatically causes the other. Pinning constrains where the worker runs, but neither relocates existing data nor freezes its pages permanently. Migration has a cost and may be incomplete. Page-migration overview.
How Linux can request or automate page migration
When enabled and supported, automatic NUMA balancing samples access patterns
using special page faults. It can influence task placement and page migration,
subject to policies and available resources. It takes work and may not adapt
before a short-lived batch disappears. Explicit interfaces such as
move_pages and migration flags on mbind can also request migration.
Balancing documentation;
scheduler NUMA fault handling;
move_pages.
Inspect your own machine
These read-only commands show the exposed CPU relationships and NUMA inventory
(numactl may need to be installed):
lscpu -e=CPU,NODE,SOCKET,CORE,ONLINE
numactl --hardware
Illustrative output for lscpu, from a simple two-node example rather than
the machine used to write this article:
CPU NODE SOCKET CORE ONLINE
  0    0      0    0    yes
  1    0      0    0    yes
  2    0      0    1    yes
  3    0      0    1    yes
  4    1      1    2    yes
  5    1      1    2    yes
  6    1      1    3    yes
  7    1      1    3    yes
Logical CPUs 0-3 belong to node 0; 4-7 belong to node 1. Match the
(SOCKET, CORE) pair to find hardware threads of the same physical core:
CPUs 0 and 1 share (0, 0), for example. The pairs 2/3, 4/5, and 6/7 each
share another core. These eight logical CPUs represent four cores in the
exposed topology, not eight independent cores.
Illustrative output for numactl --hardware on that same example:
available: 2 nodes (0-1)
node 0 cpus: 0 1 2 3
node 0 size: 16384 MB
node 0 free: 8192 MB
node 1 cpus: 4 5 6 7
node 1 size: 16384 MB
node 1 free: 12288 MB
node distances:
node   0   1
  0:  10  20
  1:  20  10
size is the memory reported for that node; free is currently free memory,
not a reservation for your process. The distance matrix expresses relative
topology, not measured nanoseconds: 20 versus 10 does not predict that your
application's remote reads take exactly twice as long.
lscpu manual; numactl manual.
A single visible node means no node-to-node choice in that exposed topology; cache locality still matters. A VM may expose one node while hiding a more complex physical host. Host topology also does not establish which CPUs or memory nodes your process may use: affinity and container/cgroup limits can restrict them. Virtual NUMA.
Check process restrictions and current page locations
Then inspect the workload, not just the host:
PID=12345  # Example only: substitute the workload's PID.
taskset -apc "$PID"
grep -E '^(Cpus_allowed_list|Mems_allowed_list):' "/proc/$PID/status"
The first query reads every current thread's affinity. The status file describes
the thread-group leader; workers may differ. /sys/devices/system/node/node*/cpulist
describes node membership, not this process's eligibility.
For containers, find the actual cgroup using /proc/PID/cgroup and the visible
mount hierarchy. Inspect cpuset.cpus.effective, cpuset.mems.effective, and
cpu.max, including accessible ancestor limits. Host-wide topology can remain
visible even when a process can use only part of it.
Finally, inspect where the pages are now:
numastat -p "$PID"
cat "/proc/$PID/numa_maps"
These show where mapped pages reside, with mapping/policy detail in numa_maps.
They do not show which pages are hot or count remote loads. Tool availability
and permissions vary.
numastat manual; numa_maps field reference.
5. Designing software around locality
A useful goal is keep frequently used data near the work that uses it, without wasting the rest of the machine. For our checkout pipeline, a worker could reuse its own input and output buffers instead of repeatedly sharing a mutable work area with every other worker.
Dividing connections or independent batches among workers gives each a useful unit of work. Per-node state is a coarser compromise when per-worker state would use too much memory.
One design keeps a long-lived worker on an assigned CPU and lets it handle many tasks: thread-per-core. Reusing data in nearby caches improves cache locality, even on a single-node machine. NUMA awareness adds the question of which memory nodes back those buffers.
Now worker A on node 0 has a queue of checkout batches, while worker B on node 1 is idle. Passing a batch to B lets it start sooner, even if B must read input from node 0. Less queueing can outweigh extra memory-access cost, depending on the workload. Keeping every batch local could instead leave A overloaded and B unused.
An idle worker taking work from another worker's queue is called work stealing. Trying nearby workers first is one possible design, not a claim about this engine's scheduler.
Packing everything onto one node can also leave other memory controllers unused. A NUMA analytics study demonstrates the tradeoff between dense worker placement and spreading work across controllers. Its experiments are workload- and machine-specific, not a universal tuning prescription.
Finally, I/O has a location. A network or storage device connects through a particular hardware path; its queues, interrupts, and buffers can interact with CPU and memory placement. AMD documents PCIe root-complex locality in its architecture overview. Pinning only application threads does not align the entire I/O path.
6. A practical example: OpenTelemetry Arrow’s Rust engine
How would a real engine organize our checkout-log pipeline? OpenTelemetry provides common data models and protocols for telemetry. The OpenTelemetry Arrow project includes protocol definitions, supporting libraries, and a Rust-based pipeline engine. The engine is one part of the project, and our example illustrates its architecture.
The three basic roles are:
- Receiver: brings data into the pipeline.
- Processor: transforms or filters it.
- Exporter: sends it onward.
A worker runs a complete pipeline
Instead of assigning a separate worker to each stage, the engine gives each worker a complete pipeline replica on its own execution thread. A batch can be received, filtered, and exported without a mandatory handoff to another worker between stages. Replica construction.
Here, replica means a copy of the configured graph, not automatic duplication of every record. How input is divided depends on the receiver; in our network example, each handles the share of connections it accepts. Connection distribution.
Each worker runs its pipeline on one thread. When a task waits for network I/O, other ready tasks can make progress. Those waits overlap; CPU instructions from that worker do not execute on several cores at once. Runtime implementation.
Figure 5 shows this arrangement twice. Follow the checkout batch through replica A: its receiver brings records in, its transform stage filters them, and its exporter sends the results. The endpoints use OTLP, the OpenTelemetry Protocol, for sending telemetry.
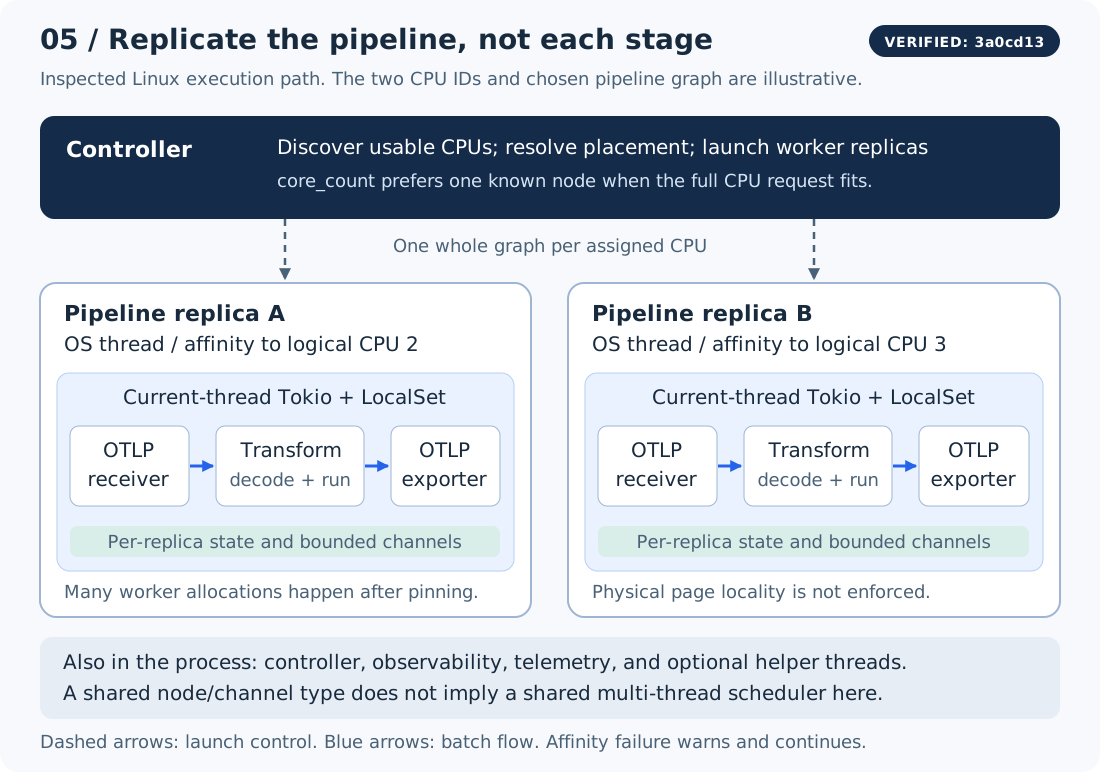
All three stages in replica A share a worker thread and its pipeline state. Replica B adds another thread for another share of input. The controller coordinates worker startup; its dashed arrows are not a broadcast of records. Now the placement question is which CPUs should run those workers.
Runtime boundaries and helper threads
The names inside Figure 5 are implementation details: Tokio is a Rust
asynchronous runtime, configured here in current-thread mode; LocalSet keeps
pipeline tasks on that thread. A "shared" node or thread-safe channel does not
imply a shared multi-threaded scheduler or automatic work stealing. Controller,
internal telemetry, and observability work also exists, and some components use
helper threads or blocking-task pools.
Runtime implementation; Tokio execution model;
Helper-thread support.
Choose where the workers run
When workers share state or exchange batches, keeping a requested group on one
NUMA node can reduce cross-node traffic. The engine first identifies eligible
CPUs and their NUMA nodes. For a positive core_count, it prefers a known node
that can fit the entire request. Otherwise it selects available CPU IDs in
ascending order, which can span nodes.
Topology implementation; Packing algorithm.
Despite the configuration's word core, these are logical CPU IDs, potentially including SMT siblings, not a count of independent physical cores. Dependency source.
Once a CPU is selected, the worker attempts affinity before building its runtime pipeline. This gives subsequent worker initialization a chance to run in the intended execution context. If affinity fails, the engine logs a warning and continues; successful pinning must not be assumed from configuration alone. Worker startup.
CPU discovery and platform fallbacks
On Linux, LinuxNumaTopologyProvider reads sysfs node CPU lists and combines CPU
affinity with available cgroup v2 effective-cpuset information. Partial discovery
can retain usable CPUs whose node is unknown. Unknown topology, including the
non-Linux default, falls back to deterministic CPU ordering; failure to enumerate
CPUs is instead a startup error. Node selection does not rank memory pressure,
measured bandwidth, or NIC distance. Affinity behavior is platform-dependent.
Topology implementation.
Let workers build their own state
Initializing the checkout worker's buffers after the affinity attempt encourages useful first-touch placement. Keeping reusable buffers and processing state on that worker can then reduce repeated setup. Some shared state exists before startup, and a reused buffer can already have backing elsewhere.
The engine chooses CPUs, not explicit memory-node pools or page-migration rules. Rust itself does not guarantee NUMA locality; Linux policy and allocator behavior still determine where fresh backing comes from. Allocator selection.
Allocator implementation
The default Linux binary uses jemalloc, a memory allocator that can reuse
already-backed memory. The engine does not install mbind/set_mempolicy
policies, allocate batches from engine-managed per-NUMA-node pools, or migrate
their pages. Some configuration, contexts, and shared structures are allocated
before worker startup.
Allocator selection.
Request a group of workers
By default, a pipeline uses every process-visible CPU. To request two workers
instead, put this policy fragment inside an existing pipeline definition,
alongside its nodes and connections:
policies:
  resources:
    core_allocation:
      type: core_count
      count: 2
This requests two worker instances and enables the counted-allocation placement
behavior described above. Insufficient unreserved CPUs cause an error. It does
not request two physical cores or reserve an entire NUMA node. CPU-time quotas
such as cpu.max do not cap this worker selection, so consider the deployment's
time budget separately.
Policy and defaults.
Other allocation modes and overlap rules
| Setting | CPU-selection behavior |
|---|---|
all_cores | Default: use every process-visible CPU for that pipeline; does not reserve them against other pipelines. |
core_count | Select unreserved CPUs. A positive count prefers one known NUMA node that can satisfy the entire request; otherwise uses ascending available CPU IDs across nodes. |
core_set | Use explicit inclusive CPU-ID ranges. These must be visible; deliberate overlap between explicit sets is allowed. |
core_count excludes CPUs reserved by explicit sets and other counted
allocations. count: 0 means all unreserved visible CPUs, not "one node."
Reservations are controller bookkeeping, not isolation from other processes or
overlapping all_cores pipelines. Overlapping policies can put multiple workers
on the same CPU.
Policies can be inherited from group or top-level scope. An explicit core_set
can choose CPUs belonging to a particular node, but those IDs must be checked
on the deployment machine.
Policy and defaults; Packing algorithm.
Balance work as well as memory
If the checkout service sends most logs over one long-lived connection, work can concentrate on one worker. On Unix, worker listeners can share a network address so incoming connections are distributed among them. That distributes connections, not individual batches. Socket helper; load-balancing guide.
To distribute batches explicitly, pipelines can connect through in-memory topics: named handoff points within the process. Balanced topic queues can spread batches among consumers. Their queues have finite capacity; a full queue can make a producer wait (backpressure) or drop work, according to policy.
Topic consumers are not selected according to where a batch's memory lives. Handing work to an idle consumer can improve utilization while making its input remote. We can now trace that trade-off through our checkout records. Topic implementation.
Socket and listener metadata boundaries
The Unix listener helper enables SO_REUSEPORT. Socket behavior is
platform-dependent. Separate listener-group NUMA metadata is data-only: it
neither binds sockets nor attaches an eBPF program to choose a listener.
Socket helper; Listener contract.
7. Trace the batch through this engine
Use an OTLP receiver, the engine's experimental transform processor, and
an OTLP exporter. For this example, each checkout record carries a string
attribute (field) named outcome. The processor supports attribute-equality
filtering, so it can retain records whose outcome is failure.
Processor documentation; Attribute-filter test.
Illustrative input and output, not a captured test run:
| Checkout record | outcome | Retained by the filter? |
|---|---|---|
| request-101 | success | No |
| request-102 | failure | Yes |
| request-103 | failure | Yes |
The output contains request-102 and request-103. This tells us which records survive, not whether their buffers were copied, shared, or newly allocated. That depends on the implementation, not the filtering rule.
Receive. A connection delivers a batch to one worker. Its receiver retains the encoded request bytes, rather than immediately decoding every record into a new processing layout. Receiver codec.
Process. The batch crosses a bounded channel to the transform task on the same worker. When its configured query applies to logs, it converts the payload to Apache Arrow records and applies the filter. Arrow is a columnar format, organizing values into typed columns suited to batch processing. The engine calls its Arrow-based telemetry representation OTAP, short for OpenTelemetry Protocol with Apache Arrow. Transform path.
Columnar layout describes how values are arranged; NUMA placement describes which nodes back their buffers. New buffers may first be populated by the worker performing conversion, subject to the allocation rules already discussed. Arrow format; Shared batch storage.
Export. The exporter encodes the retained failed-request records as OTLP and sends them onward. It reuses encoding buffers and connections and limits the number of exports awaiting completion. Exporter state.
OTAP is the representation used inside this example; both network endpoints still use OTLP. More queued batches or pending exports keep more data live, potentially displacing cached data or increasing memory pressure. Project and data-model overview.
The filter behind the checkout example
The transform processor accepts an opl_query. Our illustrative rule is
logs | where attributes["outcome"] == "failure", using its existing
string-attribute equality operation. The application supplies that attribute;
the engine does not infer request success from duration or other fields.
The parser, conversion path, and attribute-filter tests support this operation. This checkout scenario was not run as an end-to-end deployment. Query configuration; Attribute-filter test.
Logical filtering need not erase every unused value in the underlying arrays.
The processor normally sanitizes its output; skip_sanitize_result: true can
leave removed values in unused buffer regions. Do not infer storage erasure or
a particular allocation pattern just from which records are returned.
Result-buffer policy.
Now suppose one worker hands the filtered Arrow batch to another worker through a topic. In Figure 6, the producer runs on node 0 and the consumer on node 1. Does changing who processes the batch also move its memory?
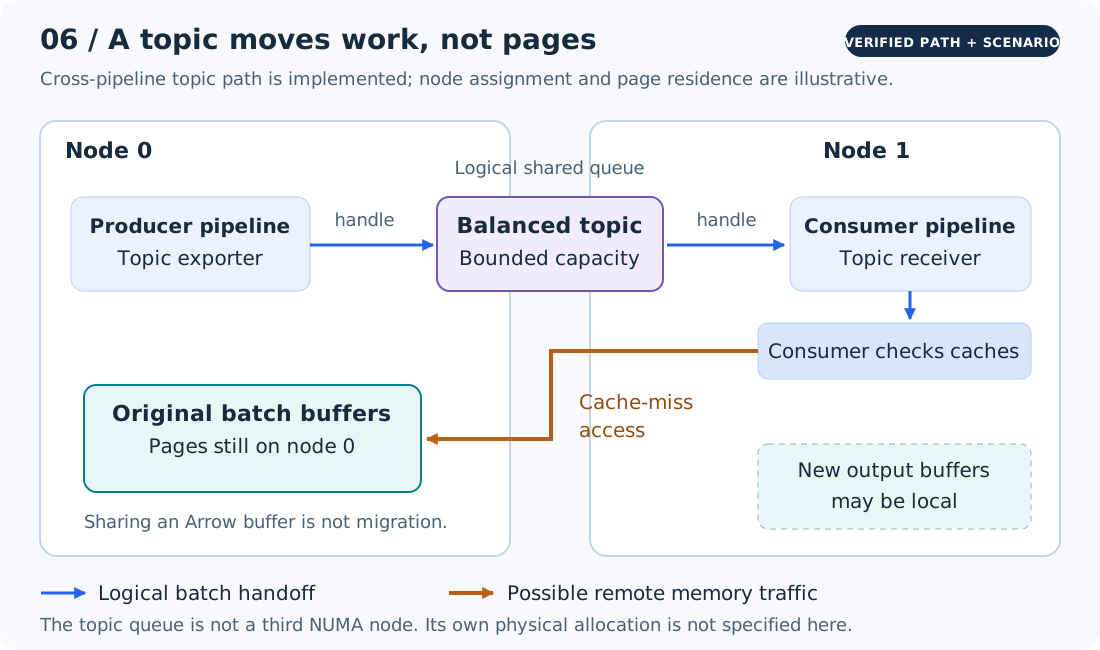
The queue hands over a shared handle, not the physical pages. The consumer may therefore read input still on node 0 while allocating new output near node 1. The diagram separates that handoff from the possible remote-memory request; neither means the original buffers were relocated.
If the split instead precedes conversion, the consumer may build new Arrow buffers itself while reading producer-owned serialized bytes. Where decoding occurs can matter as much as where the queue sits. Topic handoff and payload cloning.
Buffer and handoff implementation details
The receiver stores serialized Protocol Buffers request bytes in OtapPdata,
the engine's batch container. Protocol Buffers is a binary serialization format.
User-space transport buffers can be created while the worker runs, but this is
not proof of where their physical pages are; kernel network buffers are another
part of the path.
Topic handoffs use reference-counted shared handles (Arc) and detached control
contexts. Copying a handle gives another consumer access; it does not relocate
physical pages. Wrapper or context metadata can be copied while the Arrow
buffers remain shared.
Receiver codec; Payload cloning.
Placement mechanisms at a glance
| Mechanism | What the engine does | Potential benefit | What it does not guarantee |
|---|---|---|---|
| Topology-aware placement | Packs a positive core_count onto one node when feasible. | Less distance when selected workers share state or communicate. | Physical-core separation, balanced memory bandwidth, or page binding. |
| Worker affinity | Attempts pinning before pipeline construction. | Stable execution and better cache reuse. | Success, CPU exclusivity, or local existing pages. |
| Per-worker runtime | Runs each replica's stages on one worker thread. | Avoids compulsory inter-stage thread migration. | That every process thread or helper is pinned. |
| Worker-owned state | Builds much runtime state after the affinity attempt. | Encourages useful first allocation and reuse. | Fresh physical pages for each allocation or a permanent page location. |
| Configured topics | Transfer shared payloads through bounded queues. | Explicit batch-level distribution and backpressure. | NUMA-local consumers, relocated buffers, or equal work per batch. |
Implementation references: placement, worker startup, runtime, and topic code.
8. Where this helps, and where it costs more than it saves
NUMA hardware scales memory capacity and aggregate bandwidth. NUMA-aware software tries to use those resources without unnecessary traffic or contention.
High-throughput telemetry, in-memory databases, large caches, and memory-heavy services are natural candidates: they can maintain large working sets and repeatedly scan or update them. Packet processing adds device and queue locality. A database shard or an application-specific aggregation table may offer a stable unit of ownership.
The costs are real: configuration depends on topology, uneven work can leave capacity idle, and strict binding can cause allocation failures despite free memory elsewhere. Container limits, virtual topology, SMT, allocators, and firmware settings also affect whether a result is reproducible.
Results are workload-dependent. One database study found different effects across engines and queries, including slowdowns under some tuning changes. Treat that as a reason to measure, not a recipe to copy. Study, sections 4.1-4.5.
Context for the historical database study
The study tested MonetDB and PostgreSQL using TPC-H scale factor 20 on an eight-socket AMD Opteron 8220 machine. It changed NUMA balancing and huge-page settings together, so the results do not isolate either change. Some PostgreSQL queries became slower. These machine- and workload-specific results were not reproduced for this article. Study, sections 4.1-4.5.
Does NUMA matter on my machine? Check exposed topology and your actual allowed resources. A one-node deployment offers little visible node-placement choice, but cache locality still matters; a VM can hide physical topology.
Does it matter for a small application? Often less. A small cached working set, low throughput, or a dominant disk/network wait can leave little benefit to recover.
Should I pin every thread? Does pinning guarantee speed? No to both. Pinning can preserve locality, but can also concentrate work, select competing SMT siblings, prevent useful balancing, or pin a worker far from its data.
Does adding cores fix memory bottlenecks? Not necessarily. More requests to an already saturated controller or link can increase contention. Using another node's controller may help only if memory and work are distributed sensibly.
How do I know remote access is the problem? Correlate placement, workload profiles, and supported hardware measurements, then test a controlled change. Having pages on another node is not enough evidence by itself.
When should I leave it to Linux? Start there for general-purpose or irregular workloads, especially without measured locality problems. Take more control when stable ownership and repeatable evidence justify the extra complexity.
9. Evaluate placement as an experiment
Start with the checkout pipeline's observable behavior, not a target percentage of local memory:
- Inspect topology and restrictions. Record logical CPUs, NUMA nodes, SMT relationships, per-thread affinity, memory-node limits, CPU quotas, kernel version, and whether you are inside a VM.
- Measure a baseline. Track throughput (records processed per second), pipeline processing latency, and each worker's CPU utilization. Keep log shape, batch sizes, connections, concurrency, limits, and the destination consistent. Warm up and repeat runs.
- Change one placement decision. Compare CPU placement without also changing the allocator, batch size, or memory policy. Keep total resources comparable and use a dedicated test environment, not global tuning on a shared host.
- Compare results under the same load. Look beyond averages to tail latency, the slower end of observed processing times, often measured as the 99th percentile (p99). Check for overloaded workers, growing queues, and increased retained memory.
If the results need explanation, investigate memory placement. numastat -p
and /proc/PID/numa_maps show where pages are located. Bare numastat instead
counts allocation outcomes, such as whether a preferred node supplied memory.
Neither tells you how many later reads accessed remote RAM. A worker can
move while the pages and their allocation history remain unchanged.
Counter definitions; kernel accounting.
Hardware performance counters or sampled memory operations can help distinguish bandwidth pressure, remote accesses, and cache-coherence contention. Their availability and interpretation depend on the processor, permissions, and virtualization environment. Upstream perf manual.
What sampled memory latency includes
perf mem, where available, samples memory operations rather than observing
every load. Its reported latency is not necessarily pure DRAM latency: Intel's
use latency, for example, also includes time waiting within the CPU.
Upstream perf manual.
The target is not the smallest remote-memory percentage. It is better application behavior with a placement strategy you can explain, reproduce, and operate.
Version scope: Rust OTAP dataflow engine development snapshot beyond 0.57.0, and Linux development snapshot beyond 7.3-rc4, both reviewed on September 22, 2026. These are not the corresponding tagged releases.
No NUMA performance benchmark was run for this article.
References
Selected primary sources. More specific citations appear alongside the text.
Keep following the thread.
Back to all articles