A checkout application has just finished a request. The response status was 200 and the request took 12.5 milliseconds. Most of the time, collecting that detail for every request is unnecessary. But when checkouts start slowing down, an operator would like to see exactly those events for a few minutes, without changing the service's configuration or restarting it.
Linux user_events supports this once the application is instrumented and
has registered its events. It is a kernel interface for publishing structured
application events into Linux tracing. A local collector is a separate
program on the same machine that reads and processes these events. It can
start and stop collection without changing the running application.
The whole path in four steps
- Register: the application tells Linux about an event it can produce.
- Enable: a collector asks Linux to collect that event.
- Write: the application checks whether collection is enabled, then writes the event.
- Read: the collector reads and processes the captured records.
We'll first use a simple event with status and duration to explain the Linux
mechanism, then follow the same checkout scenario through OpenTelemetry:
a Rust application creates an OpenTelemetry log record, sends it through
user_events, and a collector writes it into a JSON file. The small C example
in section 2 is optional; it shows the Linux write interface.
Reading guide: Basic programming knowledge and familiarity with processes and memory are assumed, but not prior knowledge of the named Linux interfaces. Sections 1-3 explain the Linux mechanism. Sections 4-6 follow the two programs and their data. Section 7 covers history and compatibility. Section 8 connects the ideas with short code snippets. Sections 9-10 cover operational limits and design choices.
1. Start with one application event
Near the end of request handling, the checkout code reports that the request
completed. That place in the code is an instrumentation point. Each time it
runs, it can produce an event record describing one occurrence: here,
request_completed with status=200 and duration_us=12500. The point stays
in the program; the values can differ from request to request.
A logging call does not automatically create a Linux tracing event. To
publish through user_events, the application first registers the event with
the kernel. This creates a tracepoint: a named hook that tracing tools can
attach to. A program that attaches and reads records is a consumer.
Figure 1 shows the split. The reporting point lives in the application; the collector is a separate process. Follow the arrows for a record written through the kernel when collection is enabled.
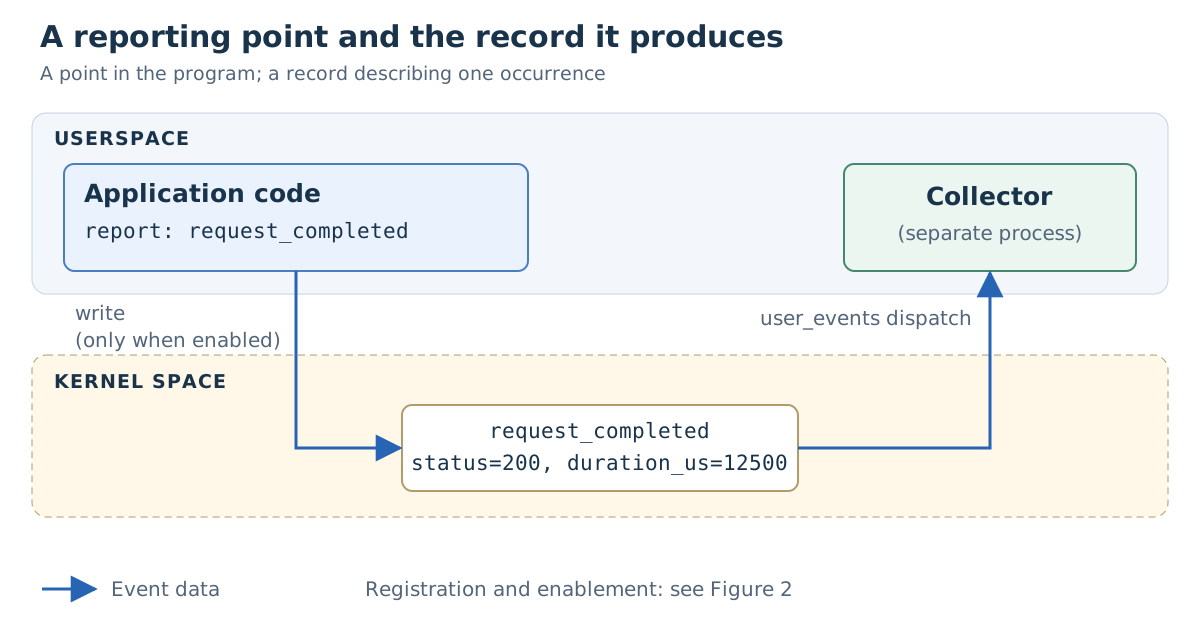
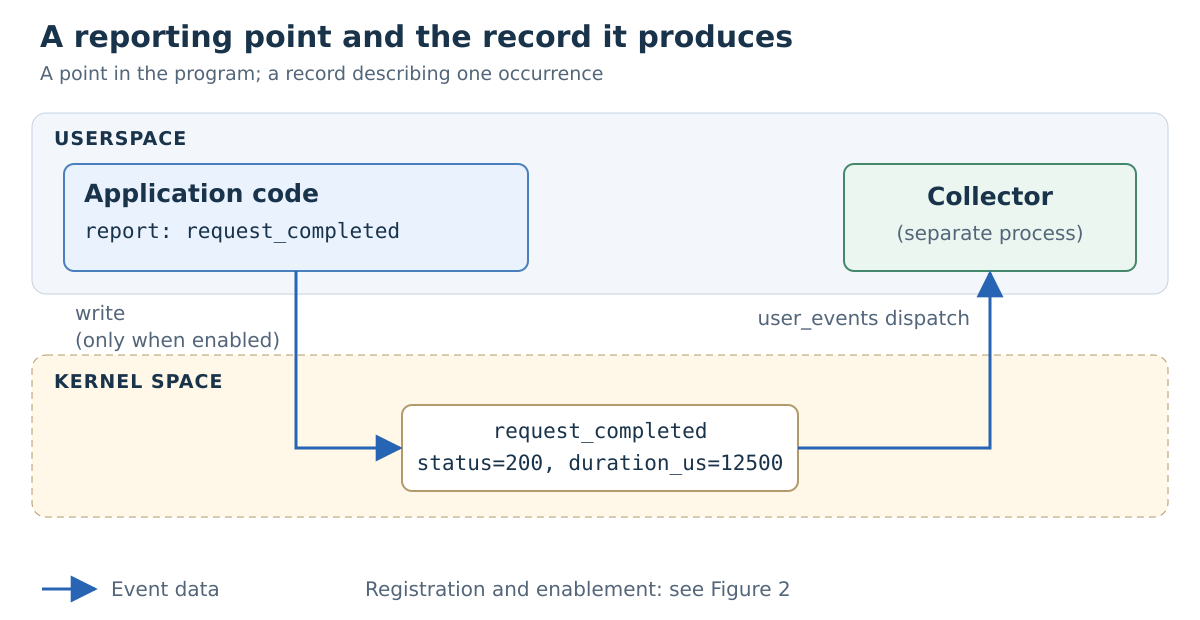
Linux does not know what status 200 means. The application, the producer, supplies the values, and the collector decides what to collect.
2. Register, enable, then write
These are steps 1-3 from the opening: the application registers its event, the collector enables collection, and a guarded application writes records while collection is enabled. The kernel checks and dispatches each write; the application and collector give it meaning.
The collection path described here uses perf, Linux's performance-monitoring subsystem. It stores event samples in kernel buffers that a local program can read. Nothing on this path sends the record to a remote backend by itself.
Register the event
First, the application tells the kernel the event's name and field layout
through tracefs, a special filesystem usually mounted at
/sys/kernel/tracing. It opens user_events_data and sends a registration
request with ioctl, the system call for control operations on an open file.
A plain field description could be:
request_completed u32 status; u32 duration_usu32 means an unsigned 32-bit integer. Write the values in field order using
native byte order, without structure padding; 12.5 ms becomes 12,500 microseconds.
The OpenTelemetry integration later needs a richer encoding.
Optional: the plain-field write in C
Once registration and the enablement check have succeeded, this C excerpt places the write index before the two values:
uint32_t write_index = registration.write_index;
uint32_t payload[2] = {200, 12500};
struct iovec parts[2] = {
    {.iov_base = &write_index, .iov_len = sizeof(write_index)},
    {.iov_base = payload, .iov_len = sizeof(payload)},
};
ssize_t written = writev(fd, parts, 2);
Registration, the enablement check, error handling, and cleanup are omitted; this fragment illustrates the write layout, not a standalone program.
Registration returns a write index for later writes through that open file. It also tells the kernel where to find an enable bit in the application's memory, which the kernel will update.
Registration identities and enable-word lifetime
The instrumentation point in application code is its emission call; the kernel creates the corresponding tracepoint dynamically. The write index belongs to the producer's open file. A consumer instead uses the event's numeric tracing ID from tracefs metadata; the two identifiers are not interchangeable.
The aligned enable word must remain at a valid address until properly unregistered. A producer can manage this directly or use a Rust producer library to manage registration and enable storage.
Let the collector enable the event
When the collector attaches and enables the event, the kernel sets the enable bit. The application checks it with an atomic load, reading its own memory while the kernel can update it, instead of asking the kernel on every request. Registration can happen before the collector starts. With retry configured, the collector can start first, but attachment waits for registration.
In Figure 2, follow the dashed setup arrows first: register, attach, update the bit. Only then does the solid data path carry an event.
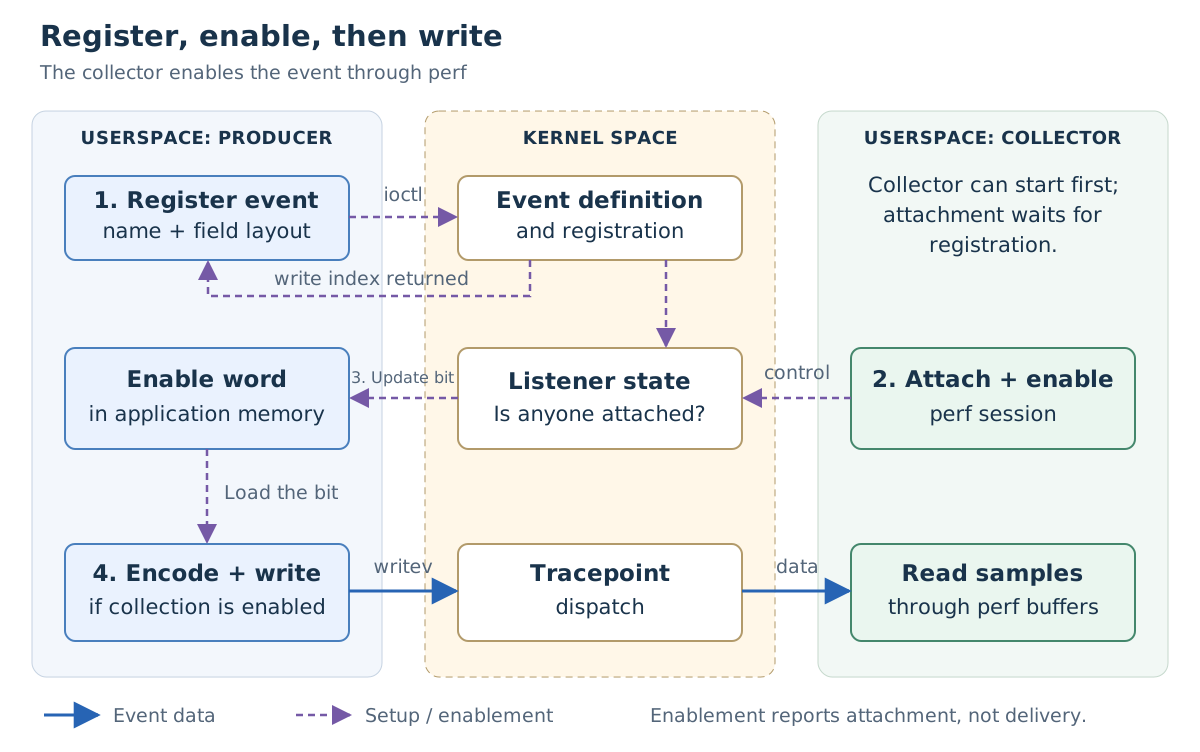
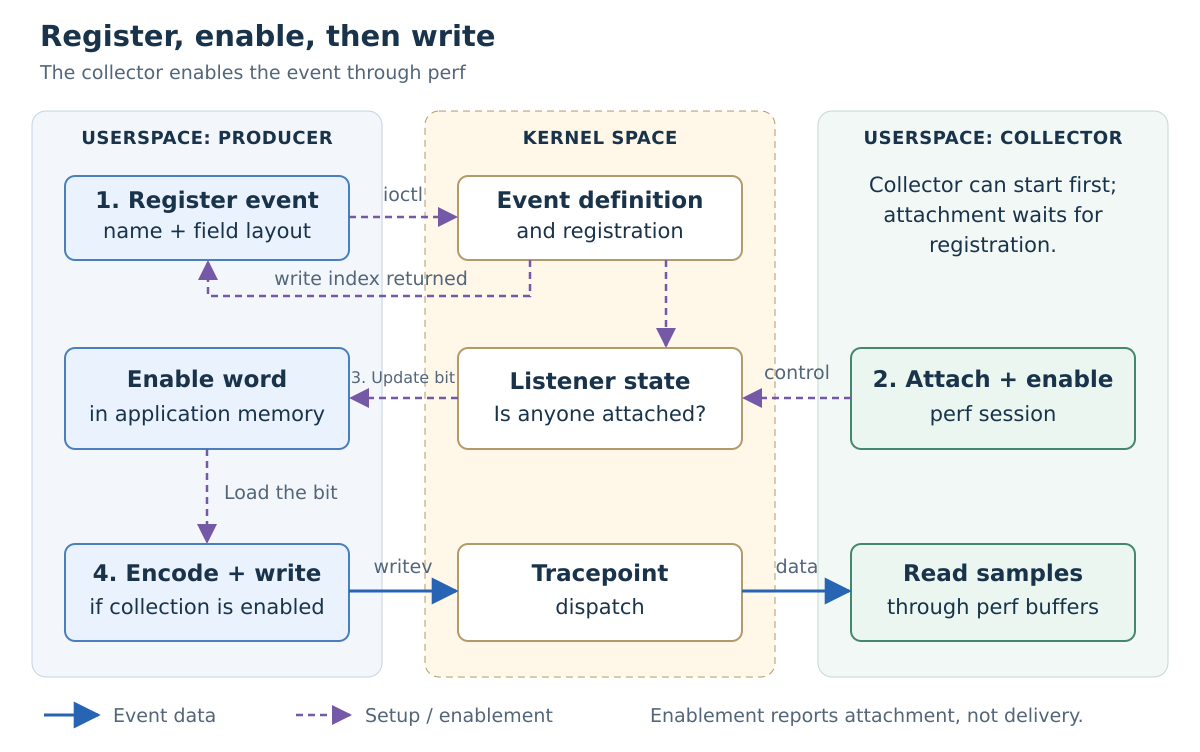
Enablement reports attachment, not delivery. The checkout service can use the bit to skip work when nobody is listening, but not as an acknowledgment.
Write the event
When the bit is set, the application encodes the checkout values and hands them
to the kernel with writev, a system call that sends the write index and
payload together. The native interface treats each call as one registered
Linux event; the index identifies which event.
The kernel checks the record, and perf records samples in its ring buffer, a bounded circular buffer that the collector reads. There is one ring for each CPU the collector covers, which matters in section 5.
If nobody is listening, a guarded application skips the write. Nothing is saved for a collector that attaches later.
Perf's copy path, mmap, and how ftrace differs
The kernel invokes attached consumers after checking the write index and
payload. The perf callback copies the data into a trace record for submission
to the ring. The collector maps that buffer into its address space with
mmap. Each covered logical CPU (potentially one hardware thread) has its own
perf-session ring.
These are perf's buffers, not a universal user_events queue. The
official guide also describes
ftrace, another Linux tracing consumer with a different recording path
and buffer policy. Neither path performs remote export by itself.
When the collector detaches between check and write
An otherwise valid write to a disabled event returns EBADF in the kernel
version covered here. Because a collector can detach just after the application
checked the bit, this error does not necessarily mean the application closed
its file.
3. Check first, then prepare
When no consumer has enabled the registered event, the guarded path below checks the enable flag and skips constructing, encoding, and writing the record. The checkout request still runs; work done before the check still happens.
A common mistake is preparing diagnostic details before checking whether anyone is collecting them. Compare these pseudocode examples:
Before: preparation always runs.
details = build_details(request)
if collection_enabled():
    emit(details)
After: preparation runs only when collection is enabled.
if collection_enabled():
    details = build_details(request)
    emit(details)
Figure 3 shows the same pattern. Follow the "no" branch: it skips preparing, encoding, and writing the event. Both branches rejoin at "Request continues"; the enabled path gets there after the write returns.
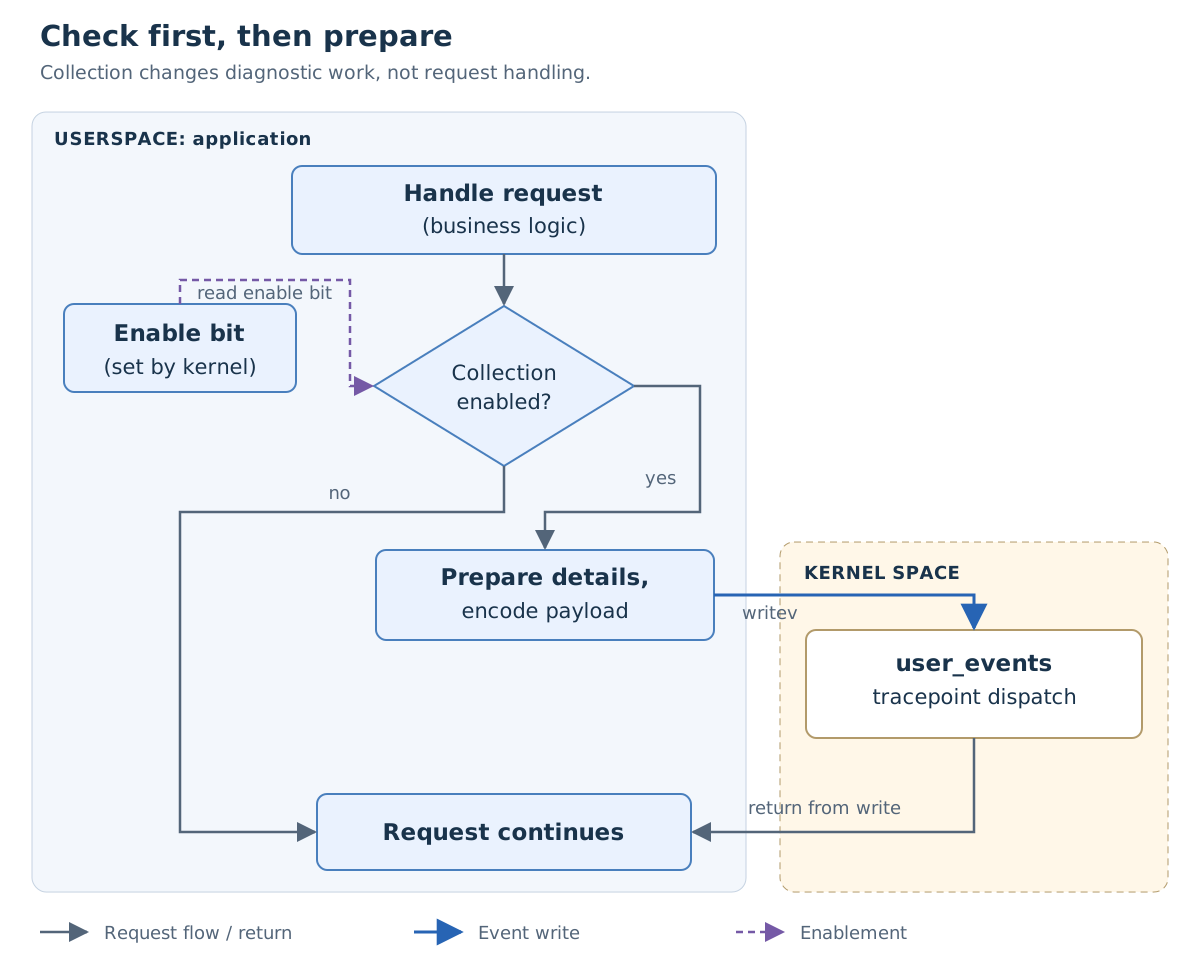
When collection is enabled, the application still prepares and encodes the event and makes one system call per write. The collector copies and decodes it. The guard avoids those event-only costs when disabled, but the enablement check and normal request work remain.
The OpenTelemetry Rust logger exposes event_enabled. A producer can call
logger.event_enabled(...) before logger.create_log_record().
Section 8 follows the resulting record through selected excerpts.
What if another SDK processor still wants the log?
In Rust SDK 0.33.0,
processor enablement is combined with any: one true answer keeps the guard
enabled. A processor's
default answer is also true.
If an always-active OTLP branch wants the record, construction cannot be skipped
just because user_events has no listener. The early guard skips construction
only when every output branch declines the event; each branch must handle
its own enablement correctly.
Compact Mermaid version of the guard
flowchart TB
    subgraph U["USERSPACE: application"]
        A["Handle request (business logic)"]
        M["Enable bit (set by kernel)"]
        B{"Collection enabled?"}
        D["Prepare details, encode payload"]
        R["Request continues"]
    end
    subgraph K["KERNEL SPACE"]
        W["user_events tracepoint dispatch"]
    end
    A --> B
    M -.->|"read enable bit"| B
    B -->|"no"| R
    B -->|"yes"| D
    D -->|"writev"| W
    W -->|"return from write"| R
    style U fill:#f3f7fc,stroke:#c5d2e1
    style K fill:#fff7e8,stroke:#b29a6a
    linkStyle 0,2,3,5 stroke:#536579,stroke-width:2px
    linkStyle 1 stroke:#7559a6,stroke-width:2px
    linkStyle 4 stroke:#2764b4,stroke-width:3px
Solid gray arrows show request flow and return from the system call; the blue arrow carries the event write. Dashed purple shows enablement.
4. Connecting user_events to OpenTelemetry
The Linux path gets checkout data into a collector. OpenTelemetry provides standard APIs and data models for telemetry; using those models involves four separate jobs.
EventHeader is an
event encoding format. In the self-describing form used here, field names and
types travel in the user_events payload alongside the values.
| Job | What it answers | In the checkout scenario |
|---|---|---|
| Mechanism | How does the application publish an event? | user_events |
| Encoding | How do fields become bytes? | EventHeader |
| Schema | Which fields and meanings does the producer choose? | message, status, duration_us |
| Mapping | Where do decoded values go in OpenTelemetry? | message becomes the log body |
Linux defines how to register and write an event, not which telemetry layout you must use. EventHeader describes fields; the schema chooses their names and meanings; the mapper translates them into OpenTelemetry. Producer and collector must agree on all three.
In section 2's plain-field path, the receiver gets field names, types, and
offsets from tracefs format metadata and applies that layout to the payload's
values. With EventHeader, it decodes application fields such as message and
duration_us using metadata inside the payload; they are not individually
listed in this producer's tracefs format. Tracefs still describes the
registered Linux event. Neither source of field metadata decides what belongs
in an OpenTelemetry log's body, severity, or resource.
A Rust application can report the checkout result as an OpenTelemetry log.
The Rust SDK
(software development kit) creates that record. An application-side exporter
encodes it and writes it through user_events. A collector-side exporter
instead writes processed telemetry to a file or sends it to a backend.
These are different components in different programs.
Figure 4 shows the two programs. Follow the arrows from the application at the top, through the kernel, to the collector at the bottom.
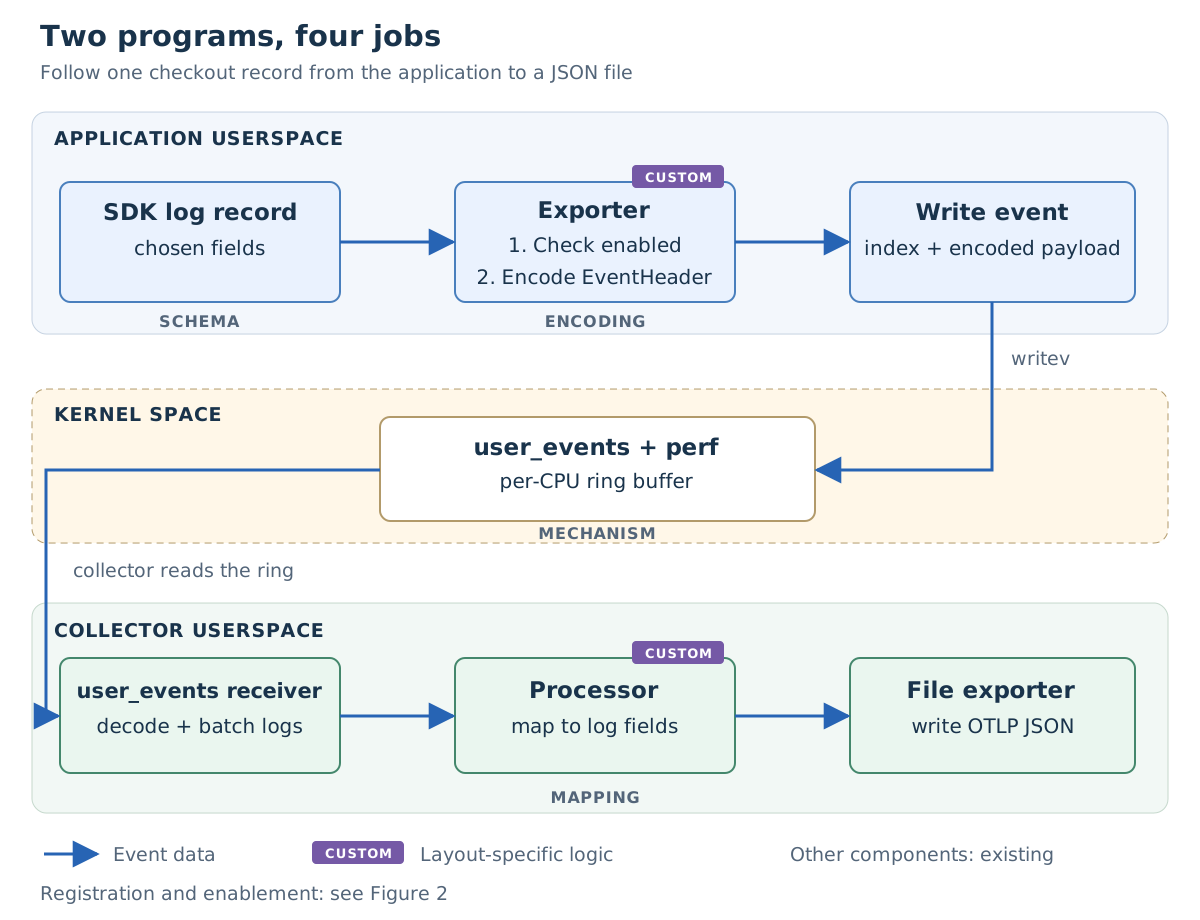
The application supplies the log values and configures the SDK provider's
resource with service.name. For a successful checkout, the message
is "checkout completed", status is 200, and duration is 12500 microseconds.
Its application-side exporter checks enablement, encodes the fields using
EventHeader, then writes through user_events. In this synchronous integration,
it implements the SDK's LogProcessor
interface and writes during emit, directly on the application thread. This processor runs inside the application,
not inside the collector.
The collector can use OpenTelemetry Arrow's Rust engine,
which runs telemetry pipelines by connecting receivers, processors, and exporters.
Its existing user_events receiver reads and decodes the event. A
collector-side mapping processor, or mapper, places decoded values into
standard log fields. The existing collector-side file exporter can write
OTLP JSON,
a JSON form of the OpenTelemetry Protocol.
A Linux tracepoint is not an OpenTelemetry span
A tracepoint is a named instrumentation hook. An OpenTelemetry span describes an operation with a start, an end, and identifying context that can connect it to other operations. Emitting a Linux event does not create a span. The OpenTelemetry logs design also supports standalone logs. A log may carry trace/span IDs for correlation; those fields do not turn the log itself into a span.
Decoding is not interpreting
The receiver's event_header decoder recovers these fields as log attributes.
It knows message is a string, but not that it belongs in the log's body.
That's the mapper's job; section 6 shows the before-and-after.
Keeping mapping in a collector-side processor makes it reusable with different collector-side exporters. A purpose-built collector-side exporter could combine interpretation and forwarding instead, but an existing exporter will not infer a custom field's meaning.
For a versioned layout, the mapper must recognize the schema version.
Rust: enablement check and write
The registered EventHeader event set supplies the application-side enablement check; the encoding sketch is in section 8.
Synchronous does not mean one thread at a time. In this integration, each calling thread encodes and writes its record before continuing; different threads can emit concurrently. The write happens during the call rather than being deferred to a background worker. The custom writer shown here uses separate encoding state for each call and does not take a shared exporter mutex during ordinary emission. This does not mean the entire path is lock-free.
Temporary records and encoding buffers still exist. Check write errors, but confirm delivery at the collector rather than treating a successful write as a receipt.
Choose the format your pipeline needs
You can adopt an existing layout or implement one for your requirements.
Rust contrib's opentelemetry-user-events-logs is an example of the first
choice: it registers its events, uses EventHeader, checks enablement before
encoding, and writes synchronously with its own predefined field layout.
Use it when that contract suits your producer and collector.
For the second choice, write or adapt an application-side exporter to carry the fields your application needs. The small, flat layout in this article illustrates that approach. Reusing EventHeader can reuse the receiver's supported-field decoder, but the collector still needs the matching interpretation of those fields. Changing the contrib logs exporter's layout requires changing or replacing its implementation, not selecting a different format in its configuration.
Producer options and current receiver support
| Producer choice | Receiver support in this version | Additional implementation |
|---|---|---|
| Plain registered fields, as in the C fragment | tracefs decodes these u32 fields into attributes. | No new decoder for these fields; semantic mapping if needed. |
| EventHeader with application-defined fields | event_header decodes supported scalars, including nested struct fields, into attributes. | An EventHeader producer using your field conventions; semantic mapping if needed. |
| Rust contrib SDK exporter | event_header decodes supported fields from its predefined mapping into attributes. | Subscribe to its provider/severity name; add semantic mapping if needed. |
| Custom encoding for a specific need | No automatic decoding of an arbitrary codec, including an embedded OTLP payload. | A matching decoder, or a verified payload carrier plus custom parser; then semantic mapping if needed. |
At the linked contrib version, there is no format-selection switch. Resource-selection and optional event-name settings do not replace its field layout. The receiver structurally decodes supported fields; a matching processor must populate body, severity, resource, and trace context where required.
Implementation details: SDK processor and builder, registration and encoder, receiver decoders, and output fields.
A common mapping is also being discussed in OpenTelemetry's OS-native tracing proposal. As of September 25, 2026, it is an open draft proposal, not an adopted specification. Its direction does not make today's producer layouts interchangeable.
Other encodings, including OTLP JSON and protobuf
An arbitrary binary format needs a matching decoder, or a receiver that preserves its payload for a custom processor to parse. A processor cannot recover bytes the receiver discarded.
One possibility is to serialize an ExportLogsServiceRequest using
OTLP JSON or binary protobuf
and carry those bytes in a registered user_events payload field. The two
programs must agree on the message type and encoding. OTLP JSON follows
specific field rules; it is not arbitrary application JSON.
The current Arrow receiver's tracefs and event_header decoders do not
automatically parse embedded OTLP. Add a receiver decoder, or a processor
that receives an exact, preserved payload. Tracefs decoding turns some fields
into base64 strings rather than raw bytes, so verify that handoff.
Decoder behavior.
After parsing OTLP into the collector's telemetry representation, its body,
severity, and resource already have standard meanings. An ordinary OTLP
exporter can then handle it without a company-specific message-to-body
mapper. A custom output exporter could combine parsing and forwarding, but
the existing exporter does not interpret an arbitrary payload attribute.
JSON is easier to inspect; protobuf is generally more compact. Neither automatically exposes the embedded fields to native tracing tools, and both must fit the per-event limit in section 9, including the wrapper. Ordinary OTLP batches can be too large. Reusing OTLP's encoding does not add HTTP/gRPC acknowledgments or retries, and it does not make the buffer durable.
There is existing source-level precedent: Rust contrib's metrics exporter carries OTLP protobuf in a byte-array field. That is a separate encoding path, not a format switch in the logs exporter or built-in OTLP payload support in the Arrow receiver.
Coordinate producer and consumer when changing a layout. An existing event name may not accept an incompatible replacement while old registrations are alive; a new name can make the transition explicit.
5. How the collector receives events
The collector's experimental, Linux-only user_events receiver listens for
specific named events. Its configuration lists those names; it does not
discover every application's events or read records from the application's
user_events_data file.
The plain-field event is request_completed. An EventHeader producer groups
events under a provider name. With a provider named checkout, Info and
Error use the following names. Use the same provider and level names in the
receiver configuration.
| SDK record | Kernel subscription name |
|---|---|
| Info | checkout_L4K1 |
| Error | checkout_L2K1 |
checkout is the provider name. L4 and L2 select
EventHeader's Informational and Error levels, not the SDK's severity numbers
9 and 17. K1 means keyword 1: a keyword is a numeric grouping mask within
a provider, set to 1 here. The payload's event_name is
request_completed in both cases. It describes the occurrence, while the
subscription name tells the receiver which group to collect.
Several payload event names can share the same provider/level/keyword group,
so its enable flag is not specific to request_completed.
The receiver uses one_collect,
a Rust event-collection library, to read tracefs format metadata and attach
through the perf_event_open system call. It then drains
memory-mapped perf buffers. This does not require running the perf command
or loading an extended Berkeley Packet Filter (eBPF) program. Reading tracefs
metadata is not reading an event stream from trace_pipe.
Each pipeline instance attaches to its assigned logical CPU only, following the engine's thread-per-core design. Figure 5 shows an application writing on CPU 0: follow its bytes into the CPU 0 ring, then up to the receiver.
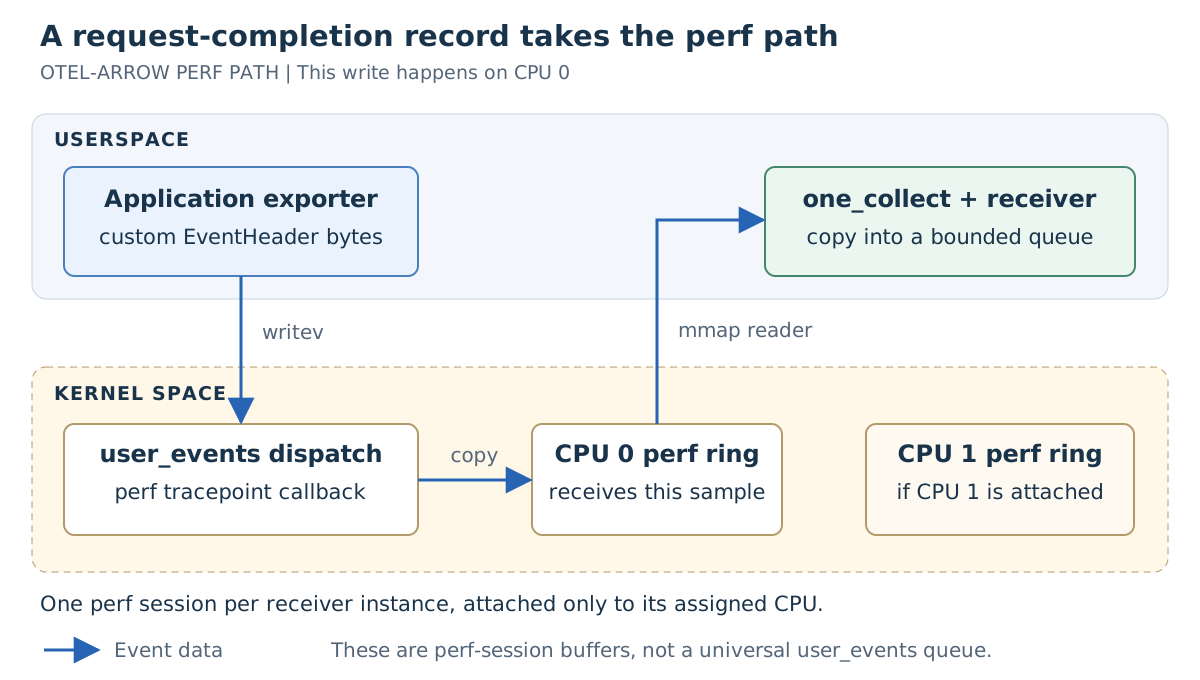
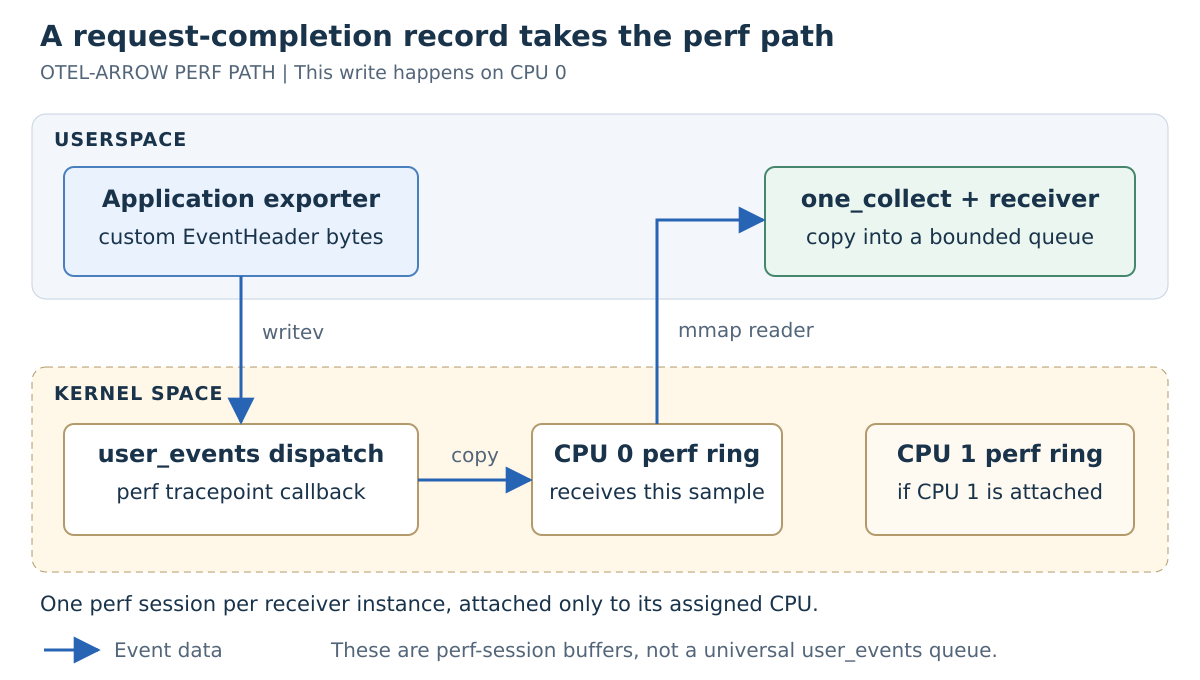
The CPU 1 ring does not receive a duplicate of CPU 0's record. It is another possible collection point, for writes performed on CPU 1. The important question is whether a session covers the CPU where the application emits.
The same request under three collection conditions
Assume successful registration, no other listeners, and the same guarded producer in each case.
| Collector attachment | Emitting CPU | Enable check | What happens to this record |
|---|---|---|---|
| None | CPU 0 | Disabled | The guard skips emission; no record is saved for later. |
| CPU 0 only | CPU 0 | Enabled | Eligible for capture by that session, but delivery can still fail. |
| CPU 0 only | CPU 1 | Enabled | No sample enters the CPU 0 session, even if the write succeeds. |
The enable bit is event-wide, not per-CPU. The last row is therefore not a contradiction: somebody attached to the event, but not on the emitting CPU. It also need not produce a perf-ring loss notification; this was missing coverage, not a full ring.
CPU coverage and NUMA locality
Coverage and placement answer different questions. CPU coverage determines whether the event is observed; NUMA locality concerns where work and memory reside. The NUMA article explains that second problem. Moving a worker closer to memory does not fix an uncovered emitting CPU.
Another listener can keep the event enabled
More than one authorized tracing consumer can attach to the same event. Stopping one collector does not necessarily clear the enable bit if another listener remains attached: the kernel recomputes it from the event's attached probes. Each consumer still needs appropriate CPU coverage and decoding. Consumers have their own attachment and buffer lifetimes.
6. Mapping event fields to OpenTelemetry logs
The receiver copies samples from the perf ring into a bounded pending queue and decodes their fields. It builds Apache Arrow columnar log batches, arranging values in typed columns. This OTAP representation, short for OpenTelemetry Protocol with Apache Arrow, begins in the collector, not in the kernel write.
In the EventHeader path, the collector receives the checkout values as attributes. The upstream decoder does not automatically populate the SDK log's typed fields from them.
What the mapper receives (schematic view):
attributes: message = "checkout completed", severity_number = 9,
            severity_text = "INFO", service_name = "checkout-service",
            status = 200, duration_us = 12500
body:       (empty)
severity:   (unset)
resource:   (no attributes)
The message is available, but the log's body is still empty. The mapper
places it in the standard body field so downstream tools can treat it as
the log message. The same applies to severity and service identity.
Mapping the checkout fields:
| Decoded attribute | Example value | Destination after mapping |
|---|---|---|
message | checkout completed | Log body |
severity_number | 9 | Log severity_number |
severity_text | INFO | Log severity_text |
service_name | checkout-service | Resource attribute service.name |
status | 200 | Log attribute status |
duration_us | 12500 | Log attribute duration_us |
After mapping (schematic view):
attributes: (unchanged)
body:       "checkout completed"
severity:   number = 9, text = "INFO"
resource:   service.name = "checkout-service"
This example copies values into the standard fields while keeping the original attributes. Another mapper could remove redundant attributes, but that is optional.
The service name identifies the source service, while status and duration describe one request. Duration remains in microseconds; mapping does not silently change its unit. Severity comes from the explicit field, not from guessing what status 200 should mean.
The scope name identifies the instrumentation. If the producer includes scope or trace-context fields, the collector also needs rules to restore them and validate their representation. Carrying trace/span IDs allows correlation; it does not create a span.
Concept-only stopping point
If you only need the mental model, sections 1-6 are sufficient. The remaining sections cover compatibility, selected implementation details, and operational choices.
7. Kernel support and compatibility
An earlier user_events interface first appeared in Linux 5.18. The
original implementation
and versioned documentation
describe a shared status mapping that producers read to check enablement.
The interface used here arrived in Linux 6.4, with the application-owned
enable_addr/enable_bit interface
documented in the 6.4 guide.
This is interface evolution: examples using the earlier producer interface
are not drop-in instructions for the current one.
A kernel version or distribution name is not enough. The code must be present,
CONFIG_USER_EVENTS=y and CONFIG_PERF_EVENTS=y must be built into the booted
kernel, tracefs must be mounted and visible, and the producer and collector need
the relevant tracefs and perf permissions.
Related instrumentation mechanisms
Ordinary kernel tracepoints invoke registered callbacks. Trace-event machinery adds descriptions and recording facilities; not every kernel tracepoint has all that machinery. The kernel tracepoint documentation describes this separation.
| Mechanism | Where the instrumentation comes from |
|---|---|
| Kernel tracepoint | A hook deliberately placed in kernel code. |
| Uprobe | A probe attached to an executable or library instruction location, often without changing its source. |
| USDT, or User Statically Defined Tracing | Named probes deliberately exposed by an application or library; Linux tooling commonly attaches through uprobes. |
user_events | Application registration of a schema, followed by explicit payload writes. |
Distro availability checked September 24, 2026
This table reports the exact x86-64/amd64 package or published configuration
checked. It is not a promise about another architecture, cloud flavor, point
release, backported kernel, or locally built kernel. CONFIG_USER_EVENTS is a
boolean option: an omitted symbol in a complete generated configuration means
it is disabled.
| Release | Kernel or package checked | CONFIG_USER_EVENTS | Official source |
|---|---|---|---|
| Ubuntu 26.04 LTS | 7.0.0-34.34-generic amd64 | y | Ubuntu package |
| Ubuntu 24.04 LTS | 6.8.0-142.142-generic amd64 | y | Ubuntu package |
| Ubuntu 22.04 LTS, HWE | 6.8.0-138.138~22.04.1-generic amd64 | y | Ubuntu HWE package |
| Ubuntu 22.04 LTS, GA | 5.15.0-191.201-generic amd64 | Disabled; symbol absent | Ubuntu GA package |
| Debian 13 | 6.12.107-1, 6.12.107+deb13-amd64 | Disabled; symbol absent | Debian source, binary package |
| Debian 12 | 6.1.187-1, 6.1.0-53-amd64 | Disabled; symbol absent; upstream 6.1 also predates the current ABI | Debian package |
| Fedora 42 | Fedora kernel-x86_64 config, package line 6.19.14 | Disabled: # CONFIG_USER_EVENTS is not set | Fedora config, spec |
| Fedora 43 | Fedora kernel-x86_64 config, package line 7.2.7 | Disabled: # CONFIG_USER_EVENTS is not set | Fedora config, spec |
| Fedora 44 | Fedora kernel-x86_64 config, package line 7.2.7 | Disabled: # CONFIG_USER_EVENTS is not set | Fedora config, spec |
| CentOS Stream 10 | Public 6.12-based source configuration | Disabled: # CONFIG_USER_EVENTS is not set | CentOS Stream config |
| AlmaLinux 10 | 6.12.0-211.56.1.el10 x86-64 config | Disabled: # CONFIG_USER_EVENTS is not set | AlmaLinux config |
| RHEL 9/10 and Rocky Linux 9/10 | No exact public binary configuration verified | Not verified; Stream or rebuild-family source is not proof of a particular installed RHEL or Rocky kernel | RHEL kernel source guidance, Rocky source service |
These results can change with an updated kernel package. In particular, Ubuntu
22.04 GA and HWE are different kernel lines. Distro backports can also add a
feature to an older version number, while a custom configuration can disable it
in a newer kernel. Check the running machine rather than inferring support from
uname alone.
8. How the record changes across the pipeline
These fragments connect an EventHeader layout to a receiver and mapping processor. Logger setup, event registration, and shutdown are omitted.
Create and emit the log record
Assume logger is an OpenTelemetry Rust SDK logger configured with a
user_events-writing SDK processor, and its provider's resource has
service.name = "checkout-service". The relevant Logger
and LogRecord
traits are in scope. Check enablement before constructing the checkout record:
if logger.event_enabled(Severity::Info, "checkout", Some("request_completed")) {
    let mut record = logger.create_log_record();
    record.set_event_name("request_completed");
    record.set_body("checkout completed".into());
    record.set_severity_number(Severity::Info);
    record.set_severity_text("INFO");
    record.add_attribute("status", 200_i64);
    record.add_attribute("duration_us", 12500_i64);
    logger.emit(record);
}
The application-side exporter still checks its own event set, because collection
may have changed or another SDK processor may have wanted the record. Below,
event_set is an already registered EventHeader set. body, severity_number,
severity_text, status, and duration_us come from the SDK record;
service_name comes from the provider's resource, supplied to the processor
through set_resource. The fragment belongs in a function returning
std::io::Result<()>; registration and cleanup are omitted.
if event_set.enabled() {
    let mut event = EventBuilder::new();
    event.reset("request_completed", 0);
    event.add_str("message", body, FieldFormat::Default, 0);
    event.add_value("severity_number", severity_number, FieldFormat::SignedInt, 0);
    event.add_str("severity_text", severity_text, FieldFormat::Default, 0);
    event.add_str("service_name", service_name, FieldFormat::Default, 0);
    event.add_value("status", status, FieldFormat::SignedInt, 0);
    event.add_value("duration_us", duration_us, FieldFormat::SignedInt, 0);

    let errno = event.write(event_set, None, None);
    if errno != 0 {
        return Err(std::io::Error::from_raw_os_error(errno));
    }
}
These are the six fields from section 6's checkout record. EventHeader describes them; it does not decide which OpenTelemetry fields the collector should populate.
Map the decoded fields
The collector-side mapper copies values from that same payload into the standard fields, leaving the original attributes unchanged in this sketch. This is mapping pseudocode, not a built-in processor API:
log.body = attributes["message"]
log.severity_number = attributes["severity_number"]
log.severity_text = attributes["severity_text"]
resource.attributes["service.name"] = attributes["service_name"]
The implementation must validate field types and define what to do when a required field is missing. Status and duration can remain log attributes. Resource information belongs to the emitting service, not to a single request.
This configuration excerpt shows the three collector stages in sequence:
{
  "connections": [
    { "from": "receiver", "to": "mapper" },
    { "from": "mapper", "to": "output" }
  ]
}
Here receiver, mapper, and output are configuration names for the chosen
nodes. A layout-specific mapper must be implemented or supplied by a component
that supports that layout; these connections alone do not create it.
How to tell it worked
Inspect the collector's output, not just the producer's return value. For the
checkout record, look for checkout completed in the log body,
the intended severity and service resource, and unchanged status/duration
attributes. Check supplied scope and trace context too.
A missing record can mean disabled collection, missing CPU coverage, a decoding
failure, or a later loss. A successful writev alone cannot distinguish those
outcomes. The buffering and delivery limits in section 9 still apply.
Deployment prerequisites and API versions
These Rust fragments use the OpenTelemetry API/SDK 0.33.0 and EventHeader Dynamic 0.5.0 APIs. The Arrow components are scoped to the source revision in the version note; a stock binary is not guaranteed to include every receiver or an application-specific mapper.
A host needs CONFIG_USER_EVENTS=y, CONFIG_PERF_EVENTS=y, and visible tracefs.
Kernel configuration, tracefs access, CPU coverage, and
perf security policy
must all permit collection. CAP_PERFMON, perf_event_paranoid, and container
syscall filters affect attachment. Perf mappings also have memory-lock limits:
perf_event_mlock_kb is a per-user, per-CPU allowance above RLIMIT_MEMLOCK;
CAP_IPC_LOCK bypasses those two limits. Containers share the host kernel and
cannot supply a missing kernel feature or an automatically private event namespace.
Permissions depend on the host's policy; do not assume either process can run
unprivileged.
Local transport is not private storage. Authorized host-level tracing consumers may read emitted fields across workloads sharing the kernel. Do not emit credentials; redact sensitive checkout data before writing the event.
9. Buffering, limits, and data loss
Where buffering happens
A batch groups records for processing or export together. A typical batched
OTLP setup uses the SDK's
BatchLogProcessor:
it keeps records in an application-side memory queue and exports batches on
a background worker. A checkout log can therefore wait inside the application
before the application-side exporter sends it.
The synchronous user_events design writes enabled records directly instead.
There is no application-side SDK batch queue on this path, but event values
and temporary encoding buffers still use application memory.
In Figure 6, compare where the checkout log can wait. The upper part of each
path is application memory; the user_events path then crosses into the
kernel's perf ring and a separate collector process. Follow the boundaries,
not just the arrows.
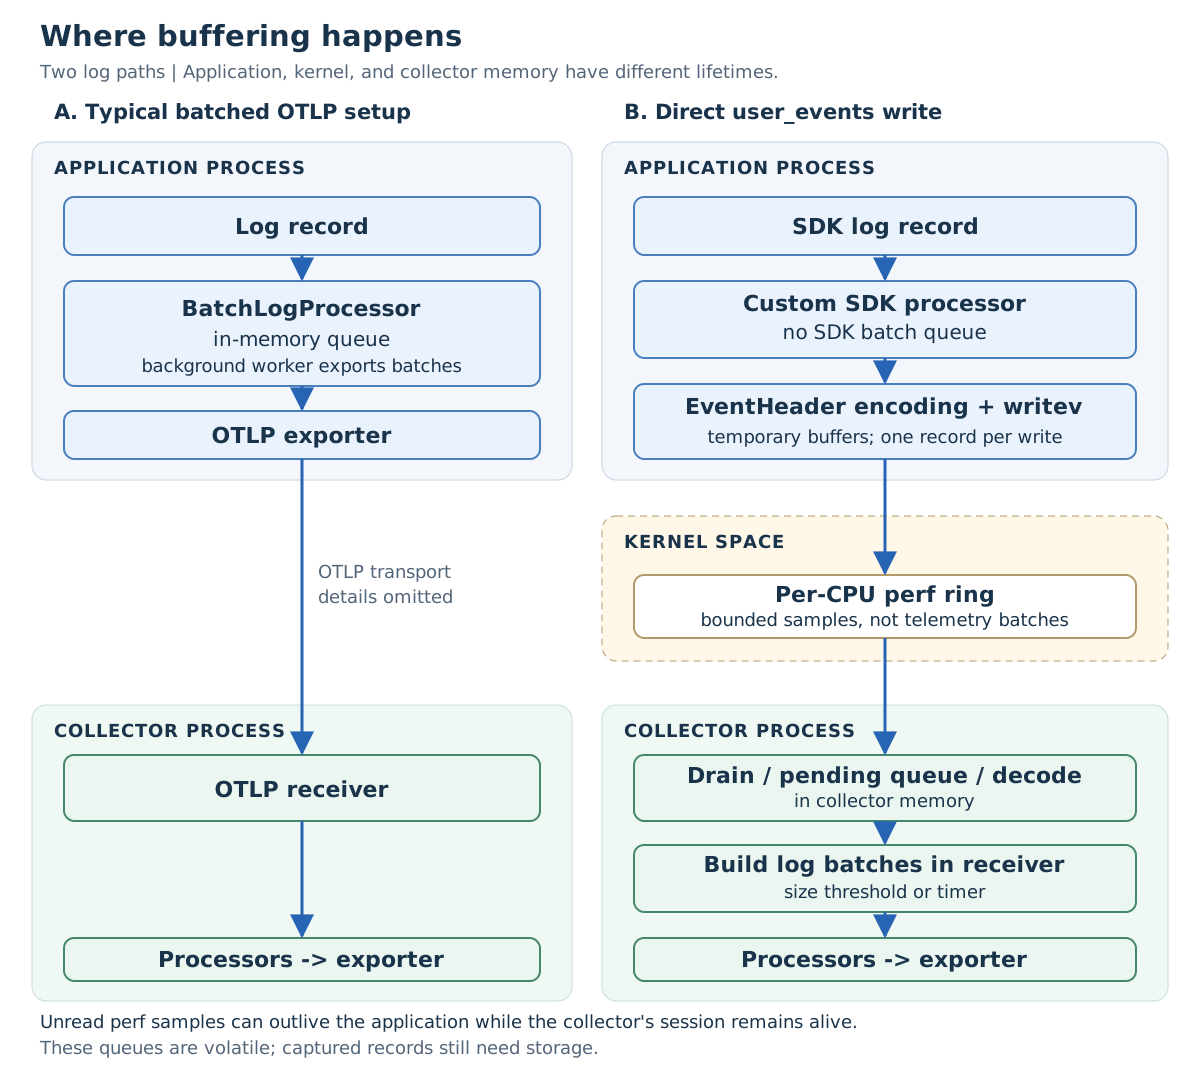
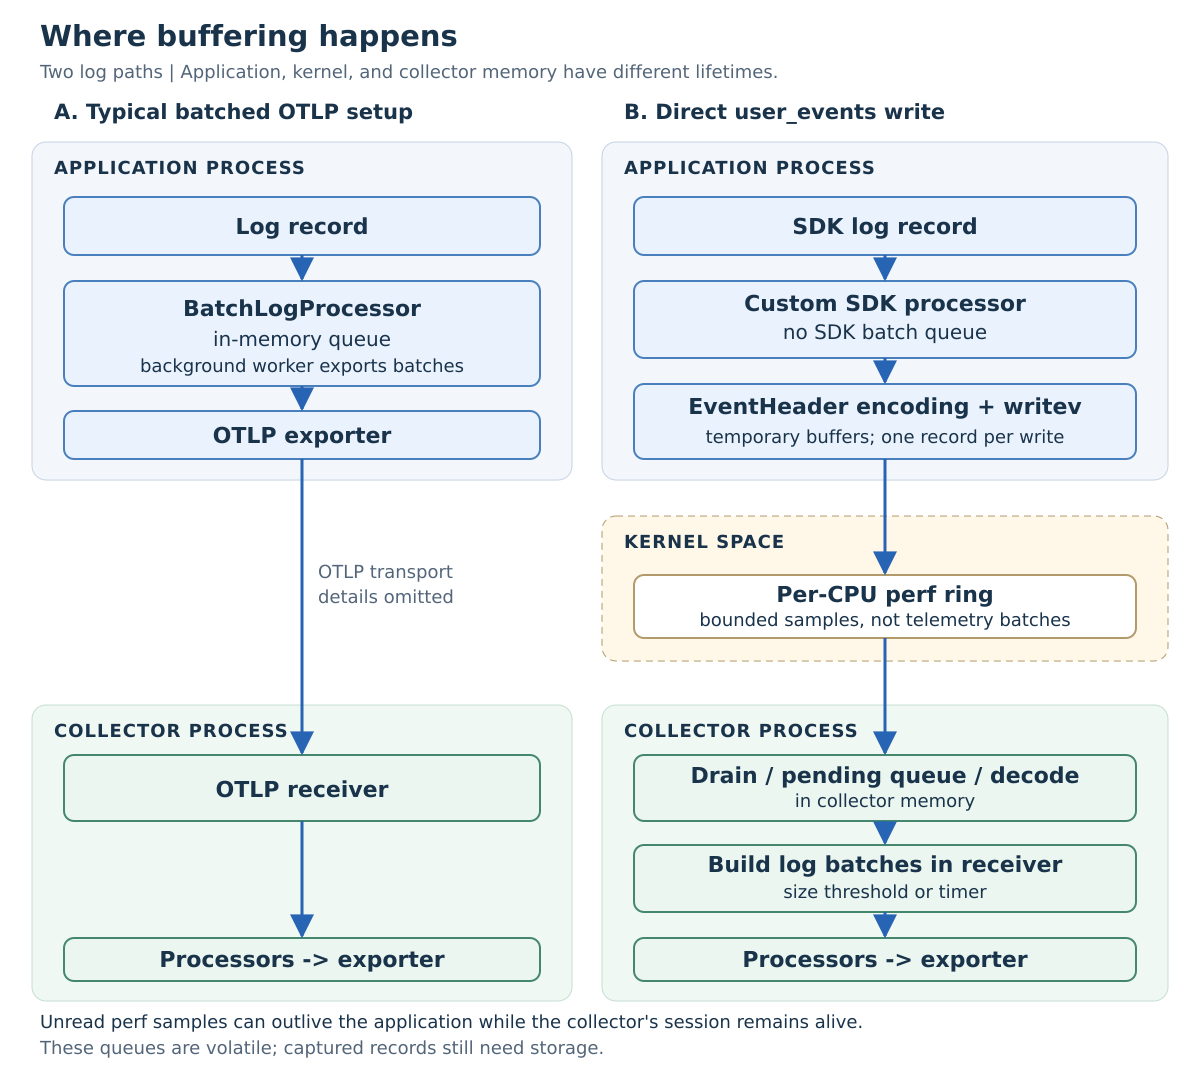
Buffering and batching are different jobs. The perf ring holds individual samples; it is not an OpenTelemetry batch processor. The Rust receiver drains samples into a bounded pending queue, decodes them, and assembles log batches for its downstream pipeline. In this version, its batching defaults are 512 records or a 50 ms timer. These are configurable flush triggers, not end-to-end latency guarantees. Receiver batching.
This batching happens inside the receiver; it does not require a separate collector batch-processor node.
What survives an application exit?
A sample already committed to an active collector's perf ring can remain available after the producing application exits. The sample is no longer in the application's heap, and the independent collector can continue reading it while its perf session and the host remain alive.
Suppose one checkout record has reached the perf ring; a second is still being encoded inside the application. If the application crashes now, the first can still be collected. The second may never be emitted. With an SDK batch queue, records still waiting in that application's queue are also lost when the process dies.
The benefit is removing that application-side queue-loss window, not making
all events crash-proof. A successful writev alone does not prove a sample
entered the ring. Missing CPU coverage and buffer overflow can prevent capture;
collector failure, perf-session teardown, or host failure can lose records
that have not reached durable storage. Receiver queues and partially built
batches are volatile too.
Why producer exit does not own the collector's perf ring
The producer's user_events_data file and the collector's perf descriptors
have separate lifetimes. A tracing consumer holds its own reference to the
event definition; closing the producer file releases producer references,
not the collector's ring. Perf buffer lifetime follows its event and mapping
references. This is a buffer-ownership argument, not a replay or persistence
mechanism.
Consumer attachment;
producer file release;
perf mapping teardown.
What happens under sustained load?
Suppose the collector receives checkout records faster than its downstream pipeline can process them. Buffers absorb a burst, but cannot make sustained overload disappear.
When downstream channels fill, the receiver waits and stops draining perf. That pressure does not reliably slow application writers: the perf ring becomes the overflow point. Pending admission can also drop records, and process memory pressure can discard decoded batches. Counters distinguish reported perf loss, queue overflow, memory shedding, and send failures; they cannot account for events never observed on uncovered CPUs.
Do not assume global ordering across CPUs. Batching and optional round-robin subscription draining also affect downstream order. There is no durable spool, replay protocol, or exactly-once guarantee in this path.
Four different sizes matter here. The single-event limit bounds one payload.
The perf ring capacity bounds captured samples waiting in the kernel. The
pending queue bounds parsed samples waiting inside this receiver. The
batch size and timer decide when decoded logs are sent downstream. They are
not one shared user_events buffer.
Different receiver policies can change queue capacities and flush thresholds, but not the recording path's per-event size limit.
Kernel constraint
A single event must fit the recording path's per-event size limit. Encoding headers, field metadata, and values all consume that budget. In the reviewed perf path, an oversized sample can be dropped before entering the ring even when the producer's write reports success.
If you pack multiple telemetry records into one Linux event, its wrapper and all records share that event's byte budget. This is not a limit on the collector's batches assembled after capture. A larger perf ring cannot raise the per-event limit.
Multiple telemetry records inside one Linux event
The kernel write parser
reads one write index and treats the remaining bytes as that event's payload.
Passing [index A][payload A][index B][payload B] to writev does not emit two
Linux events: the second index is just part of the first event's payload.
Instead, register an event whose payload describes a batch. A possible layout, not captured output, is:
[write index for a batch event]
[batch metadata][record 1][record 2]...[record N]
Fixed-size records can share a schema and use a record count. Variable-size
records need boundaries, such as per-record lengths; mixed record types also
need a way to identify each type. OTLP protobuf already defines framing for
repeated log records. These are choices inside the payload,
not a native multi-event user_events API.
For the reviewed perf path, the size calculation is:
batch metadata + sum(encoded record sizes) <= 8,184 bytesCount every encoding header, length field, and any OTLP resource/scope envelope. The four-byte write index is consumed before dispatch and is not part of this budget. For example, two already-encoded 4 KiB records need 8,192 bytes before any batch metadata, so they cannot fit together. Splitting records across separate events is different from fragmenting one oversized record, which would require its own framing, bounded reassembly, and missing-fragment handling.
The current Arrow receiver appends one decoded log per captured sample. A batch-aware decoder or a processor receiving the preserved payload must expand it into separate telemetry records. Its existing outgoing batch setting does not unpack an incoming batch. That is an implementation choice, distinct from the kernel's event boundary and byte limit.
Batching can amortize system-call work, but waiting to form a batch adds application buffering and latency. Dropping one captured batch can lose every record inside it. Perf's timestamp, PID/TID, and CPU describe the batch write; enablement selects the registered batch event. Include original per-record context when needed. This is a design possibility that requires the additional decoding support described above.
Library and receiver defaults
| Buffer or limit | Default | Scope | Configuration knob | When exceeded |
|---|---|---|---|---|
| Perf ring data capacity | Requested 1 MiB; rounded up to a power-of-two page count | Each covered CPU in one perf session owned by a receiver instance; subscriptions in that session share it | session.per_cpu_buffer_size, bytes | This receiver uses a writable, forward perf mapping: new samples are dropped rather than old unread samples being overwritten; perf later reports loss |
| Receiver pending queue | 4,096 events or 16 MiB of raw event bytes | Aggregate session queue inside one receiver instance; optional subscription caps sit below the same aggregate ceiling | session.limits.max_pending_events, session.limits.max_pending_bytes; optional per-subscription limits | New parsed samples that do not fit are dropped |
| Collector batch | 512 decoded records or 50 ms | One receiver instance's in-progress OTAP batch | batching.max_size, records; batching.max_duration, duration | Reaching either threshold flushes the batch; downstream blocking can stop ring draining |
The queue's byte counter covers copied raw event_data, not all Vec, decoded
Arrow, or allocator overhead. Likewise, max_duration is a flush trigger, not
an end-to-end latency guarantee. The configured wakeup_watermark defaults to
256 KiB but is currently parsed and unused, so changing it has no effect in this
receiver snapshot.
Size accounting, burst example, and tuning details
| Limit | Value in the reviewed kernel | Scope | Configuration knob | When exceeded |
|---|---|---|---|---|
| One emitted event through the perf callback | 8,192-byte trace scratch record, leaving at most 8,184 bytes of user payload | One callback invocation in this Linux path | None; kernel constant | Callback drops the oversized sample before ring insertion; the producer write can still report success |
In
the kernel's perf callback,
PERF_MAX_TRACE_SIZE is 8,192 bytes and user_event_perf requests aligned
scratch space for an 8-byte trace-entry header plus the user payload. That
leaves 8,184 payload bytes. The four-byte file-local write index is consumed
before dispatch and does not count. Application encoding headers, such as an
EventHeader header, do count because they are payload. Perf's outer sample
record then adds its own record header and selected metadata, including
identifier, PID/TID, timestamp, and raw-field length, in the ring. The
8,192/8,184 figures are therefore specific to this kernel's user-events-to-perf
callback, not universal limits for ftrace, future kernels, or every
user_events consumer.
Hypothetical sizing only: suppose the complete stored perf sample averages
256 bytes after including the payload, the 8-byte trace-entry header, perf's
record header and metadata, length fields, and alignment. A 1 MiB ring holds
roughly 1,048,576 / 256 = 4,096 such samples. At 20,000 samples per second it
could absorb about 4,096 / 20,000 = 0.205 seconds if the reader stopped
completely. The collector normally drains concurrently, so this is a burst
estimate, not expected retention time. Eight such CPU rings require about
8 MiB of data pages, plus one perf metadata page per ring and userspace queues.
A receiver session covering one CPU opens one ring; broader CPU coverage
creates more rings.
Increasing session.per_cpu_buffer_size can absorb a larger temporary burst.
It cannot fix sustained overload, increase the 8,184-byte single-event limit,
or make records durable. This receiver's perf mmap is writable/non-overwrite:
when it fills, the kernel rejects new samples and accounts loss; it does not
silently replace the oldest unread sample as an overwrite-mode ring would.
Larger rings also consume more locked memory and may fail to map under
perf_event_mlock_kb, RLIMIT_MEMLOCK, or capability policy.
All receiver settings above come from the pinned
receiver defaults,
ring construction,
and pending admission.
Aggregate pending limits, optional subscription limits, drain limits, and
batching.max_duration must be greater than zero. batching.max_size is a
u16 but this snapshot does not reject zero; zero causes the first appended
record to satisfy the size-flush condition, so use a positive value. A requested
ring size of zero still becomes one page; other values are rounded up to at
least one page and then to a power of two before conversion to pages.
10. When to use user_events
Return to the checkout that started slowing down. Once the application is instrumented and has registered its events, a collector can enable a short diagnostic window without restarting the application. When collection stops, the guarded path can skip the event-only work again.
Choose the producer layout and the collector's handling together: reuse an existing contract or define fields for your needs. Enablement, CPU coverage, and semantic mapping are separate responsibilities; none promises delivery.
| Approach | Best understood as | Practical trade-off |
|---|---|---|
| Conventional application logging | Records written to stdout, files, or a logging service | Familiar tooling and portability; filtering, persistence, and collection depend on the chosen stack. |
| Direct OTLP export | Application-to-collector telemetry transport | Preserves the standard telemetry model more directly; applications manage encoding, queues, and connection/export behavior. |
| This user_events path | Linux-local, dynamically enabled event collection | Separates local producers from collectors, but adds kernel policy, CPU coverage, decoding, and semantic-mapping responsibilities. |
These paths can coexist: routine telemetry could continue over OTLP while
selected diagnostics use user_events. A local collector can forward mapped
logs through its OTLP exporter,
keeping network-endpoint and authentication handling there for that route.
Mixed SDK outputs have the enablement interaction described in section 3.
Before switching, compare the same checkout workload with your existing path: the application's work, the collector's work, and the records actually received.
Keep these four ideas:
user_eventsis a local Linux tracing interface, not a remote telemetry protocol.- An operator can enable collection from outside the application, without restarting it. The application must already be instrumented and its events registered. An enablement check can avoid event-only work, but it does not acknowledge delivery.
- Perf collection is per CPU and bounded. The collector must cover the emitting CPU and keep up with its records.
- Use it for selective Linux-local diagnostics. Prefer ordinary logging or direct OTLP when portability and standard semantics matter more.
Version scope: Linux development snapshot
(Makefile version 7.3.0-rc4) and
OpenTelemetry Arrow snapshot,
reviewed September 22, 2026;
Rust contrib snapshot,
rechecked September 25, 2026. Code snippets show integration patterns;
they are not a complete program. To validate this explanation, one
EventHeader-based logs path (register, enable, write, decode, map) was verified
end to end on Ubuntu 24.04.3 LTS, kernel 7.0.0-1014-azure, using sudo.
References
Selected primary sources. More specific citations appear alongside the text.
Keep following the thread.
Back to all articles